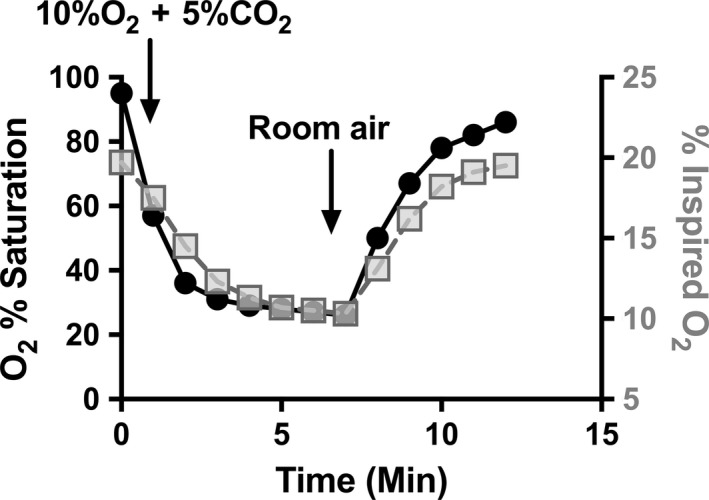
Figure 2.

Changes in oxygen saturations in response to ventilation with hypoxic/CO 2 gas. Noninvasive oxygen saturations (filled circles, left y axis) in one animal (M4) were tracked at baseline on room air, during ventilation with 10%O2 + 5%CO 2, and during return to ventilation with room air after imaging was completed. Inspired oxygen concentration (grey squares, right y axis) was measured at the inspiratory limb of the ventilation circuit at the animal to determine rate of decline and recovery in actual inspired oxygen.
