Figure 3.

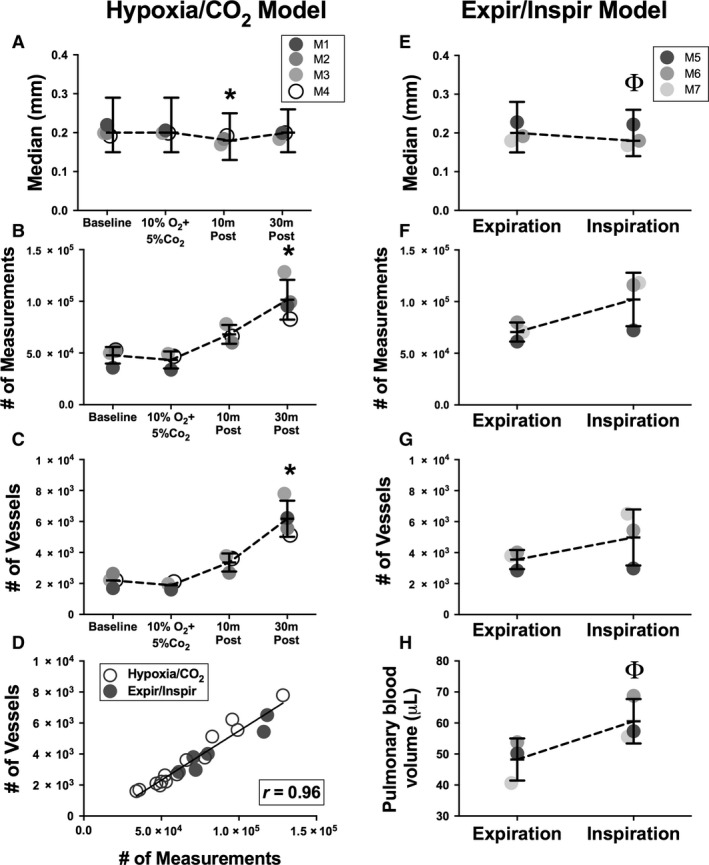
Measurements of changes in the murine pulmonary vascular tree during exposure to hypoxic/CO 2 gas and with positive pressure mechanical ventilation. Three‐dimensional murine pulmonary vascular trees were reconstructed from CT scans performed without intravenous contrast. Median diameter measurements, numbers of diameter measurements and vessels, and pulmonary blood volumes were determined. (A, E) Median diameters (± IQR) of pulmonary vessels detected for individual mice in response to hypoxic/CO 2 gas exposure (animals M1‐4) and from end‐expiration to end‐inspiration (animals M5‐7); (B, F) Mean ± SD number of diameter measurements that were able to be obtained from the vascular tree for each experiment; (C, G) Mean ± SD number of vessels that were detected from the vascular tree for each experiment; (D) Correlation of number of diameter measurements obtained to number of vessels detected from each vascular tree for all scans (r = 0.96, P < 0.0001); (H) Mean ± SD total pulmonary blood volume during positive pressure ventilation from end‐expiration to end‐inspiration. Baseline = no treatment; 10%O2 + 5%CO 2 = during ventilation with 10% oxygen and 5% carbon dioxide; 10 m Post = 10 min of ventilation with room air after ventilation with 10%O2 + 5%CO 2; 30 m Post = 30 min of ventilation with room air after ventilation with 10%O2 + 5%CO 2. Expiration = data from vascular tree reconstructed from end‐expiratory phase of CT scan; Inspiration = data from vascular tree reconstructed from end‐inspiratory phase of same CT scan. *P < 0.001 in comparison to all other timepoints. (P < 0.05 in comparison to Expiration.
