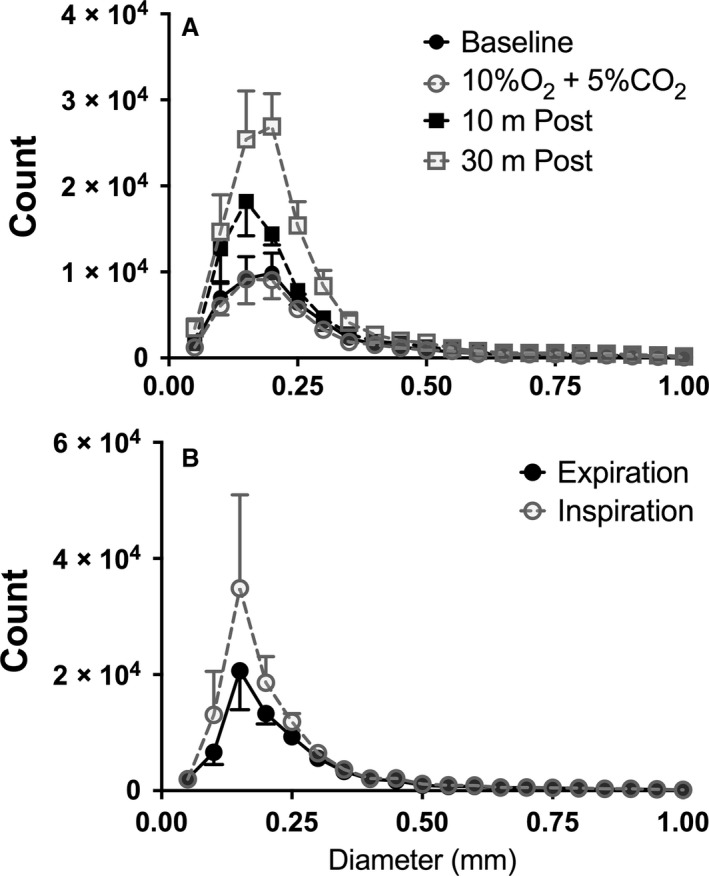
Figure 4.

Distribution of diameter measurements from murine pulmonary vascular trees during exposure to hypoxia/hypercarbia (A) or from expiration to inspiration with positive pressure ventilation (B). Histogram of data counts are presented as the mean (± SD) across animals per 0.05 mm unit range of detected vessel diameters. The peak (mode) number of diameter measurements are at 0.16 mm for hypoxia/CO 2 data and 0.17 mm for Expir/Inspir data.
