Figure 4.

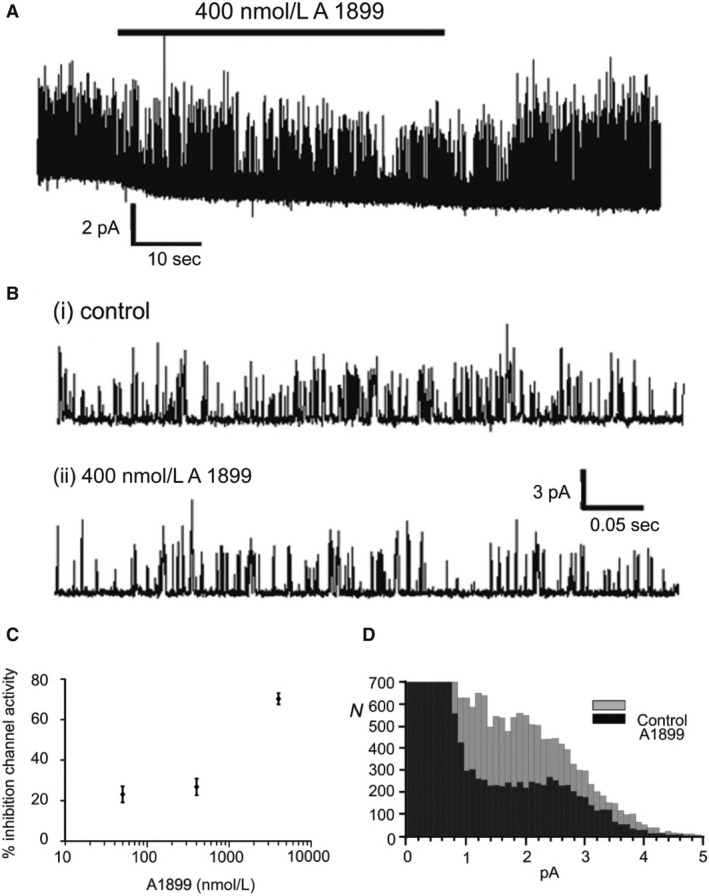
(A) Representative recording of type‐1 cell TASK channel activity over ~1.5 min of a cell‐attached patch recording demonstrating inhibition of channel activity by 400 nmol/L A1899. (B) Data from same recording over ~0.5 sec intervals under control conditions (i) and in the presence of A1899 (ii). (C) Concentration‐response relationship of effects of A1899 on type‐1 cell TASK channel activity (expressed as % inhibition in the presence of A1899 compared to control). Data are mean ± SEM (n = 4, 8 and 6 for 40, 400 and 4000 nmol/L concentrations of A1899, respectively). (D) Representative all‐points frequency histogram showing reduction of current at all levels corresponding to channel open states. Each bar represents a 0.1 pA bin width. Data were generated from analysis of 20 sec segments from cell‐attached recordings.
