Figure 5.

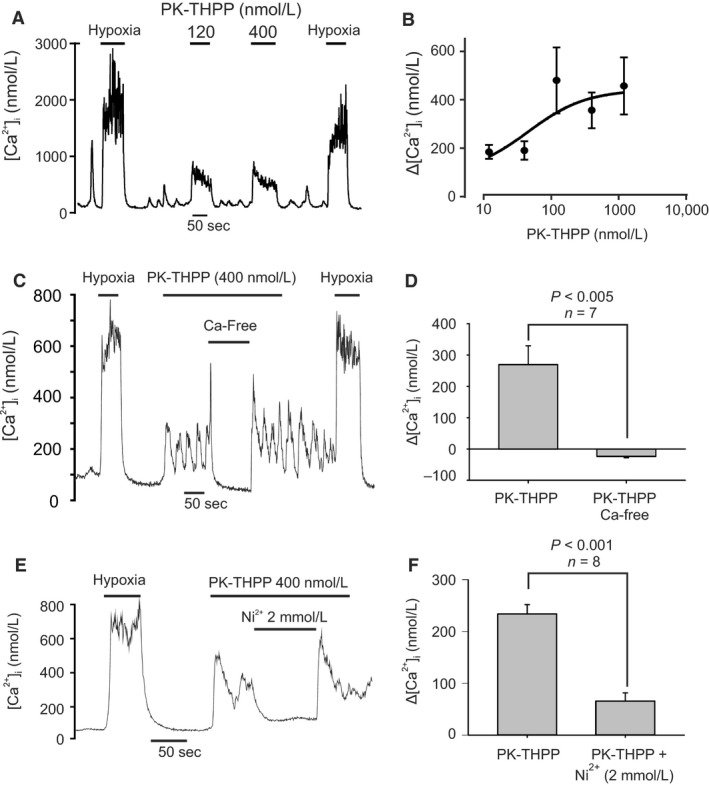
Effects of PK‐THPP on type‐1 cell [Ca2+]i. (A) Recording showing effects of application of two different concentrations (120 and 400 nmol/L) of PK‐THPP causing an abrupt rise in [Ca2+]i. (B) Concentration‐response graph of effects of PK‐THPP on [Ca2+]i. Each point represents mean ± SEM (n = 5–7) and the curve is fit by non‐linear least squares regression to the equation Δ[Ca2+]i = a + b. [PK‐THPP]/(EC50 + [PK‐THPP]). The estimated EC50 is 45.2 nmol/L and the r 2 for correlation is 0.19. (C) Effect of Ca2+ free Tyrode on [Ca2+]i responses evoked by 400 nmol/L PK‐THPP. Note rapid reduction in [Ca2+]i in the absence of external Ca2+. (D) Summary data showing effects of PK‐THPP on Δ[Ca2+]i ([Ca2+]i in the presence of PK‐THPP minus baseline [Ca2+]i) under normal conditions and in the absence of extracellular Ca2+. Data are mean ± SEM. Statistical comparison is a paired t test. (E) Effect of 2 mmol/L Ni2+, a voltage‐gated Ca2+‐channel inhibitor, on [Ca2+]i responses evoked by 400 nmol/L PK‐THPP. Note rapid reduction in [Ca2+]i upon application of Ni2+. (F) Summary data showing effects of PK‐THPP on Δ[Ca2+]i under normal conditions and in the presence of Ni2+. Data are mean ± SEM. Statistical comparison is a paired t test.
