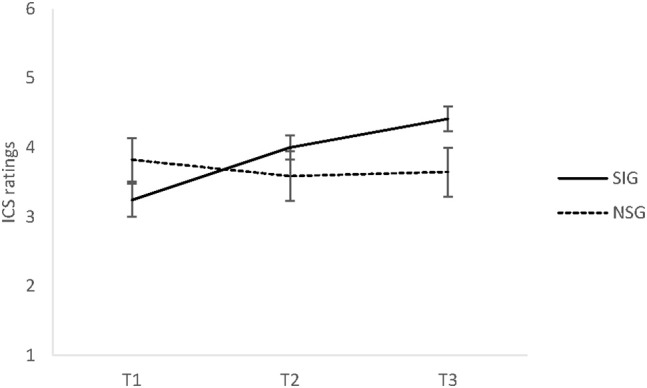
Figure 3.

The means and standard error of the mean (SEM) of perceived social connectedness (SOC) in Experiment 2 for the singing group (SIG) and non-singing group (NSG) at baseline (T1), after 30 min (T2), and after 60 min (T3). SIG, singing group; NSG, non-singing group; ICS, inclusion of communityin self scale (range 1–6).
