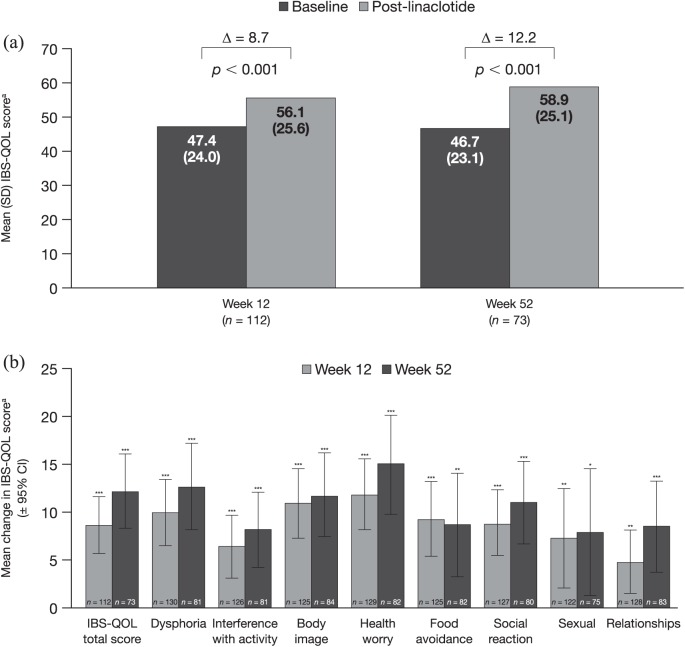
Figure 5.
IBS-QOL overall score at 12 and 52 weeks (a) and change from baseline in IBS-QOL overall score and domain scores at 12 and 52 weeks (b).
aScored from 0 to 100 (higher scores indicate better functioning).
*p < 0.05; **p < 0.01; ***p < 0.001.
CI, confidence interval; IBS-QOL, Irritable Bowel Syndrome Quality of Life; SD, standard deviation.

