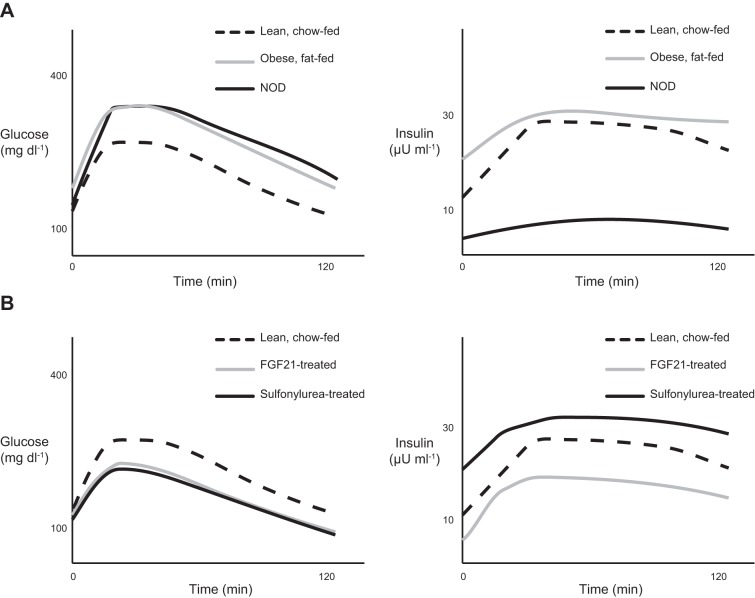
FIGURE 10.
Interpretation of glucose tolerance tests requires measurement of plasma insulin concentrations. A: diet-induced obese and prediabetic nonobese diabetic (NOD) mice both display glucose intolerance compared with lean chow-fed control mice, but the causes differ. The diet-induced obese mice mount a normal or even heightened insulin secretory response but are hyperglycemic owing to insulin resistance. The prediabetic NOD mice are glucose intolerant owing to defective insulin secretion. B: improved glucose tolerance can similarly result from increased insulin sensitivity [fibroblast growth factor 21 (FGF21)-treated mice] or from increased insulin secretion (sulfonylurea-treated mice).

