
Figure 3.
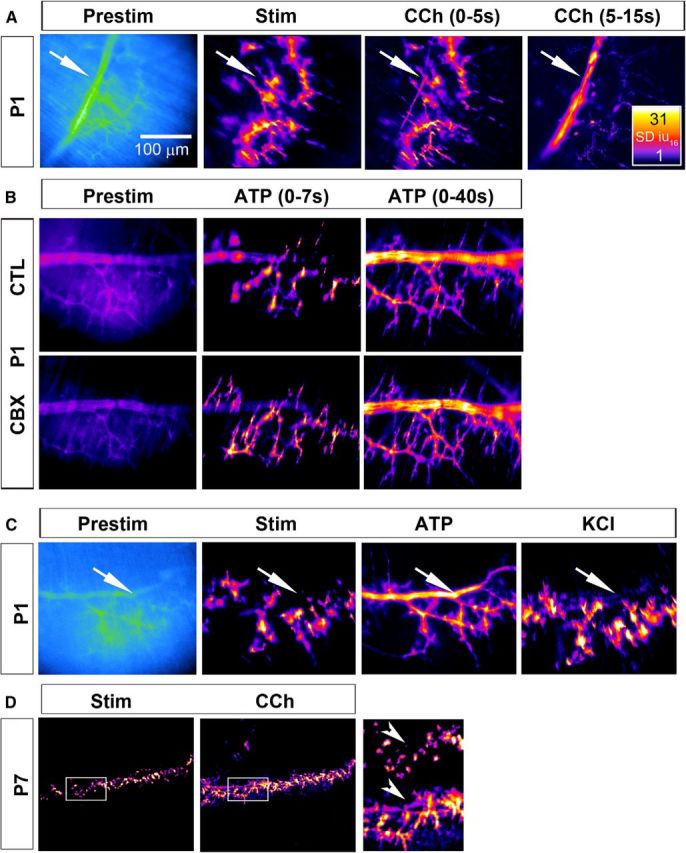
The loss of activity-induced Ca2+ responses in ASCs does not result from a loss of competence to respond to nerve stimulation. A, Left, Average fluorescence intensity image (Prestim, blue and green) of a diaphragm of a P1 Wnt1-GCaMP3 mouse. Arrow marks the secondary phrenic intramuscular branch. Middle left, Spatial intensity map of Ca2+ responses to 30 s of 20 Hz phrenic nerve stimulation; note the presence of TPSC and tertiary ASC responses, but the absence of ASC responses along the secondary branch (arrow). Middle right, right, In contrast, treatment with CCh produces a response in both TPSCs and secondary/tertiary ASCs. The Ca2+ response in ASCs occurs after that of TPSCs (compare signal along secondary branch in right panel, 5–15 s after nerve stimulation onset, with that in middle right panel, 0–5 s after onset) (see Figure 3-1). B, Left panels, Prestimulation images (in black and purple) of the same P1 Wnt1-GCaMP3 diaphragm. Middle, right panels, Spatial intensity map of Ca2+ responses in response to ATP (0–7 and 0–40 s after ATP treatment; note the delayed response, similar to the response to CCh, of secondary branch-associated ASCs, relative to tertiary ASCs and TPSCs). This distal-to-proximal activation pattern of SCs (top row, control; CTL) was not affected by treatment with 100 μm carbenoxolone, an inhibitor of gap junctions (bottom row; CBX). C, Prestim images (in blue and green) of the same P1 Wnt1-GCaMP3 diaphragm after nerve stimulation, ATP or KCl. The robust activation of Ca2+ responses in ASCs after TPSCs (arrow) was not observed after treatment with KCl, in contrast to ATP. D, ASCs still respond to neurotransmitter at P7, despite not being activated by nerve stimulation. In the enlarged images to the right, note the response of ASCs to CCh but not to nerve stimulation (arrowheads) in the same diaphragm.