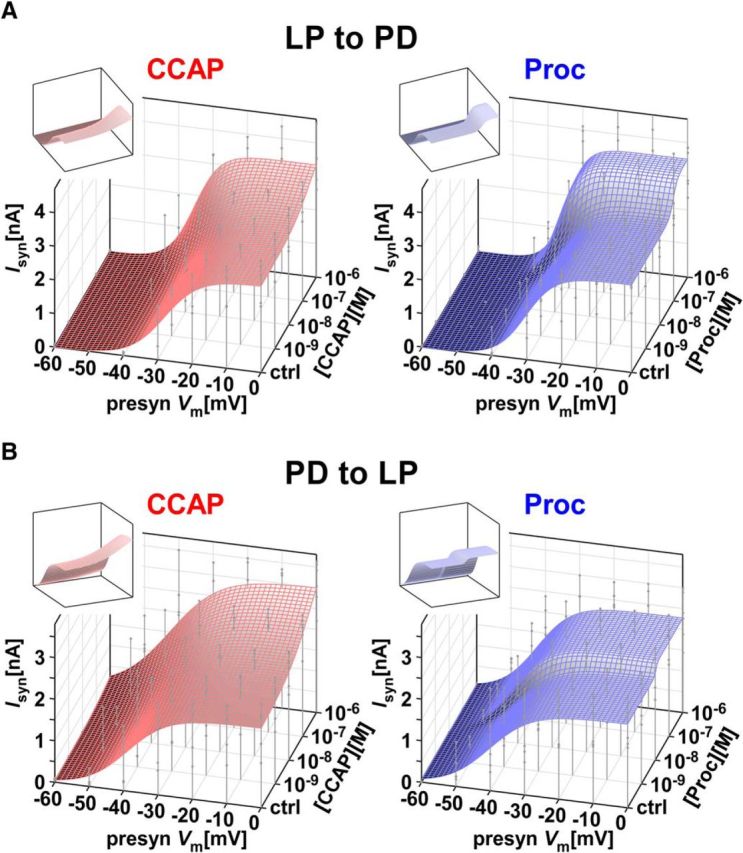
Figure 4.

The dose-dependent influence of CCAP and Proc on the activation curves of the two synapses was used to construct predictors of modulation on synapses. A, Double-sigmoidal surface fit (Eq. 3) to the activation data of the LP to PD synapse in different doses of Proc or CCAP can be used to estimate the influence of the respective modulator on the synapse at any presynaptic voltage and any concentration of the modulator. Droplines indicate measurement points of the experimental data, with the filled circles marking the data points. Insets show the same surface from a different viewpoint. B, Same as A, but for the PD to LP synapse. The fit parameters were as follows: A, CCAP: a1 = 3.619, a2 = −1.042, a3 = −38.00, a4 = 9.890, a5 = 3.197, a6 = 1.920, Cmid = −6.556, Cc = 0.5555; A, Proc: a1 = 3.508, a2 = −0.902, a3 = −34.68, a4 = 4.320, a5 = 2.913, a6 = 1.324, Cmid = −7.018, Cc = 0.1359; B, CCAP: a1 = 3.632, a2 = −1.735, a3 = −44.74, a4 = 5.82, a5 = 8.135, a6 = −2.116, Cmid = −6.455, Cc = 0.8039; B, Proc: a1 = 2.273, a2 = −0.2560, a3 = −42.43, a4 = 2.090, a5 = 5.184, a6 = 1.126, Cmid = −7.958, Cc = 0.04605.
