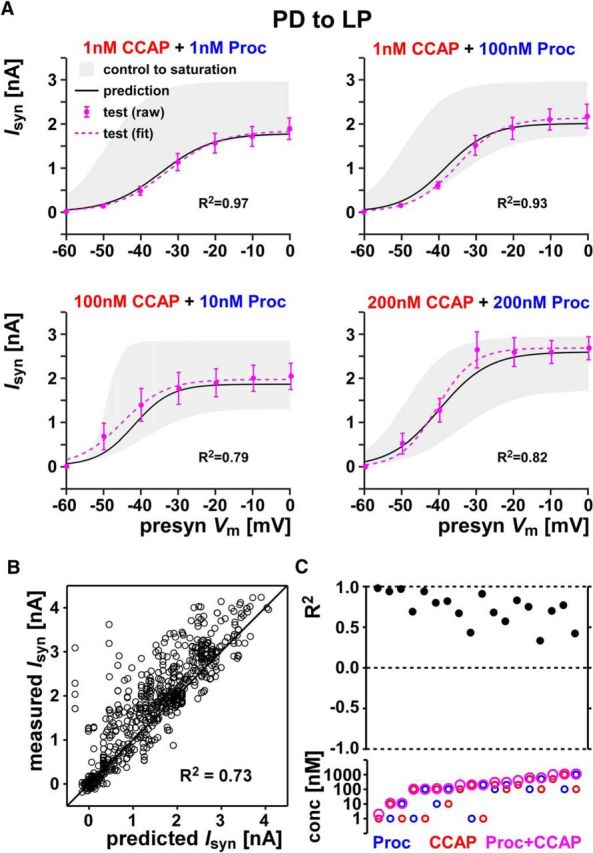
Figure 7.

Co-modulatory effect of CCAP and Proc on the PD to LP synapse can be predicted from linear summation up to saturation. A, PD to LP synaptic current activation curve in response to co-applied CCAP and Proc at four different concentration combinations (test, raw and fit) is well predicted by the model (prediction). Also shown is the range of synaptic currents measured in the respective experiments (control to saturation). The R2 values in each case show the goodness of the prediction. B, Prediction values compared with the actual measurements for all data points in the 18 different combinations of co-modulation measurements of the PD to LP synapse. Also shown for comparison are the line of perfect prediction (y = x) and overall R2 values. All data points are provided in Figure 7-1. C, R2 values shown for each of the 18 co-modulation combinations of the PD to LP synapse. R2 = 1 indicates perfect predictions, whereas R2 = 0 indicates that the prediction was no better than the mean of the data. The bottom panel shows the concentration of Proc, CCAP, and total concentration (Proc+CCAP) in each case. Data are shown in order of increasing total concentration. Each combination included five or six preparations.
