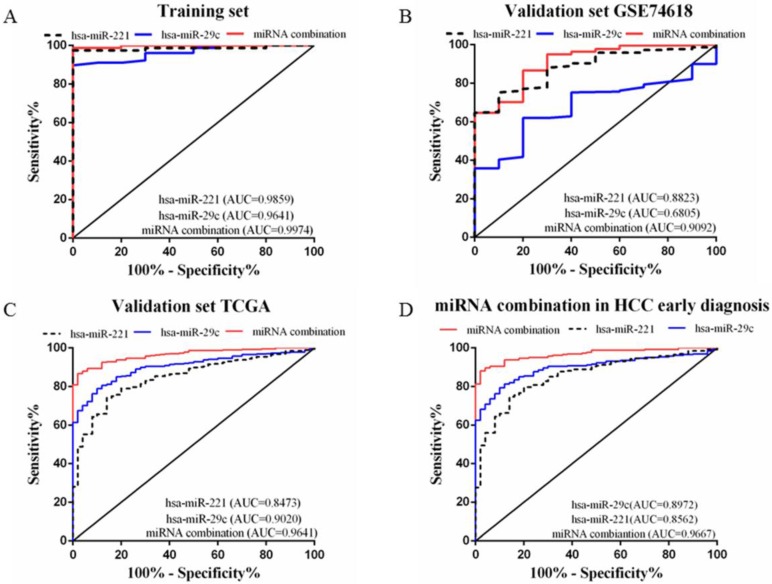
Figure 3.
ROC curves to compare the diagnostic accuracy. Notes: ROC plots for the (A) Training set; (B) Validation set GSE74618; (C) Validation set TCGA; (D) microRNA combination in discriminating HCC patients of TNM stage Ⅰ/Ⅱ from the healthy individuals.

