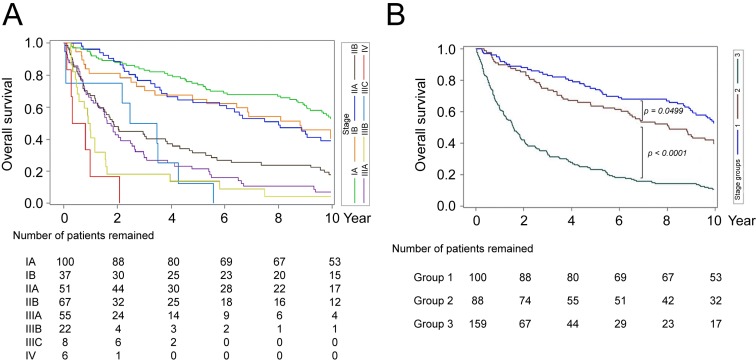
Figure 1.
Kaplan-Meier analysis of postoperative OS in patients with gastric SRCC stratified by tumor stages. (A) Postoperative OS in gastric SRCC patients stratified by the TNM tumor staging method. Different stages were represented by different colors of curves, shown at the right side of the figure. (B) Postoperative OS in gastric SRCC patients stratified by re-classifying the patients into group-1 (stage IA; blue), group-2 (stage IB/IIA; brown), and group-3 (stages IIB through IV; green).

