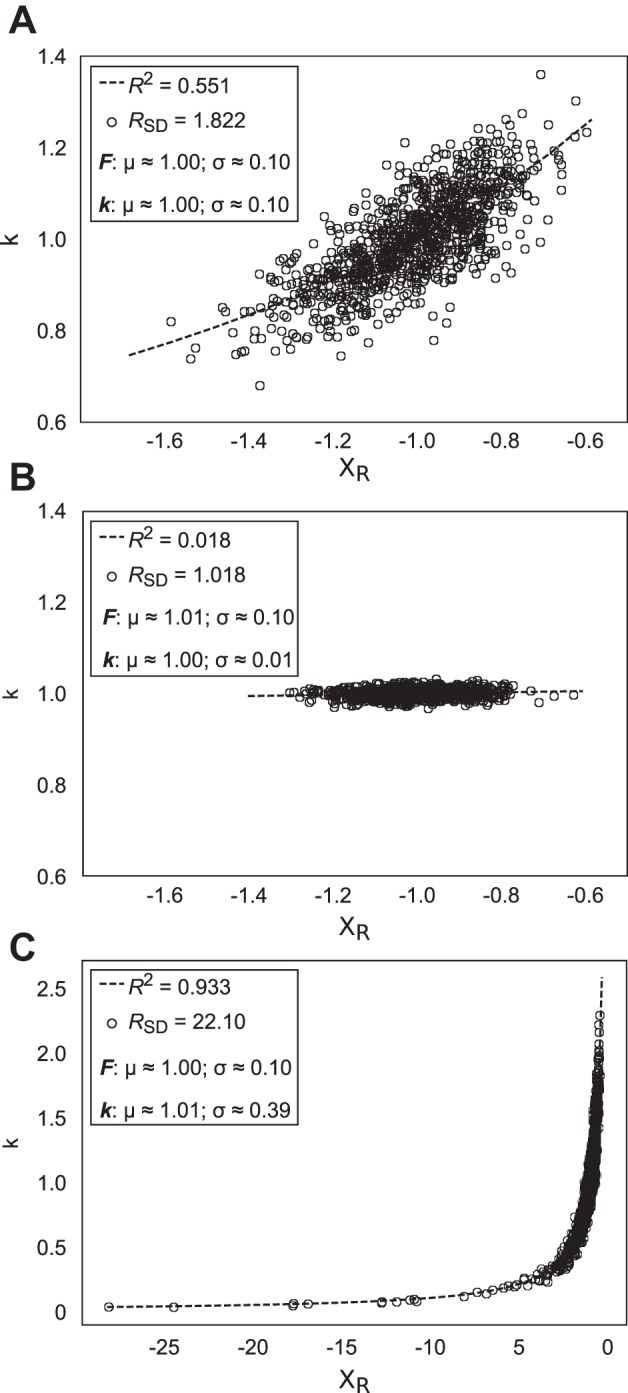
Fig. 10.

Results of 3 simulations that exemplify the effects of variability of apparent stiffness, k, on the computed metrics RSD and R2. R2 refers to the best-fit hyperbola denoted by the dotted lines in A–C; RSD is the ratio of mean standard deviation of permuted data to nonpermuted data (see methods). In each simulation, 1,000 force (F) and k values (denoted by open circles) were randomly selected from independent normal distributions. In A–C, the mean of the normal distributions from which F samples were selected = 1.0, and standard deviation = 0.1. The mean of the normal distribution for k = 1.0; in A, the standard deviation of the k distribution = 0.1; in B, the standard deviation of this distribution = 0.01; and in C, the standard deviation = 0.4. The values of mean (μ) and standard deviation (σ) in the panels refer to the sample means and standard deviations of the actual data used in the simulations.
