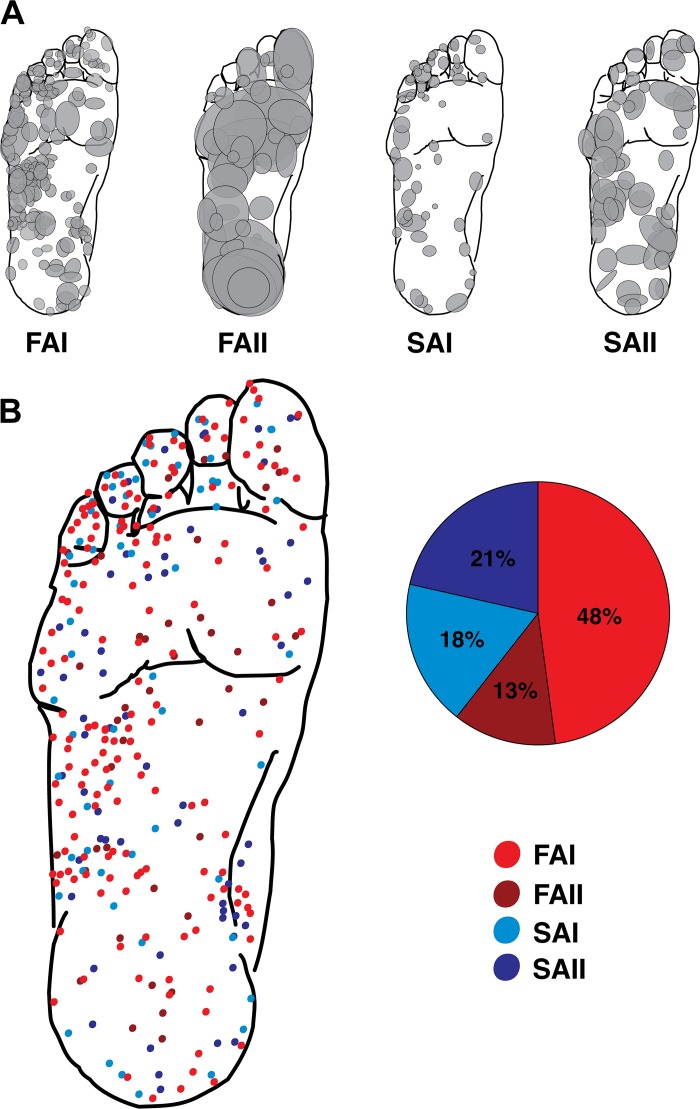
Fig. 2.
Receptive fields of the different cutaneous mechanoreceptor classes. A: foot sole maps for each afferent type showing all the receptive field locations and estimates of size in the present data set. Shaded ellipses represent individual afferent receptive fields. B: composite foot sole map showing the center of all receptive fields overlaid on the same foot template. Pie chart depicts the breakdown in terms of the percentages of each afferent type in the present data set. FAI, fast-adapting type I; FAII, fast-adapting type II; SAI, slowly adapting type I; SAII, slowly adapting type II.

