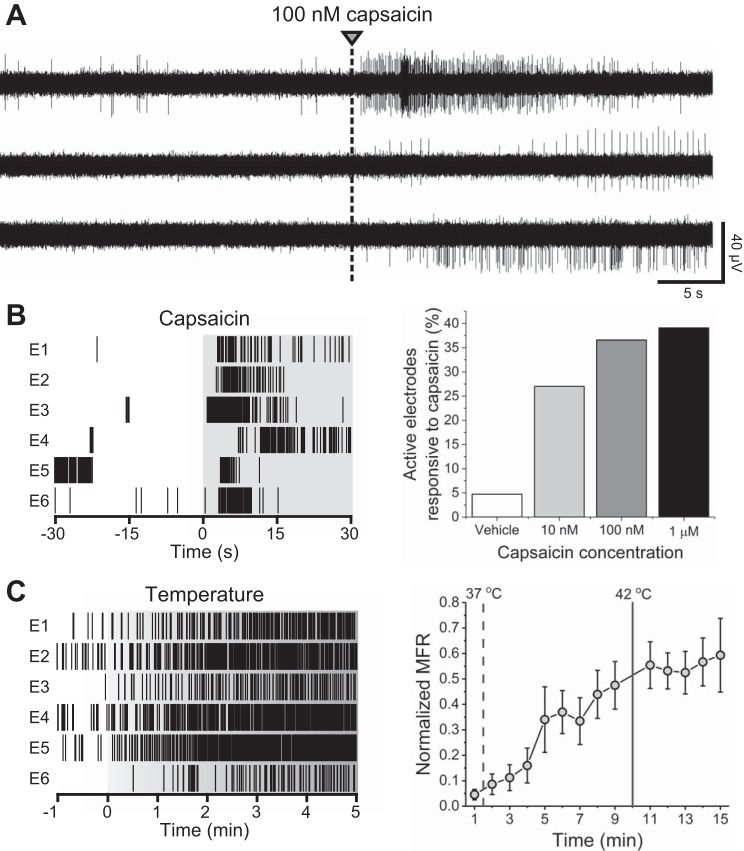
Fig. 4.
Capsaicin and temperature responsiveness. A: representative continuous data traces from electrodes within a single well exhibiting responsiveness to 100 nM capsaicin. B: representative raster plots from 6 10 nM capsaicin-responsive electrodes (E) within a single well (left) and capsaicin concentration responsiveness as a percentage of active electrodes (right). C: representative raster plots from 6 temperature-responsive electrodes within a single well (left). Normalized mean firing rate (MFR) during calibrated temperature increase from 37 to 42°C.

