
Fig. 6.
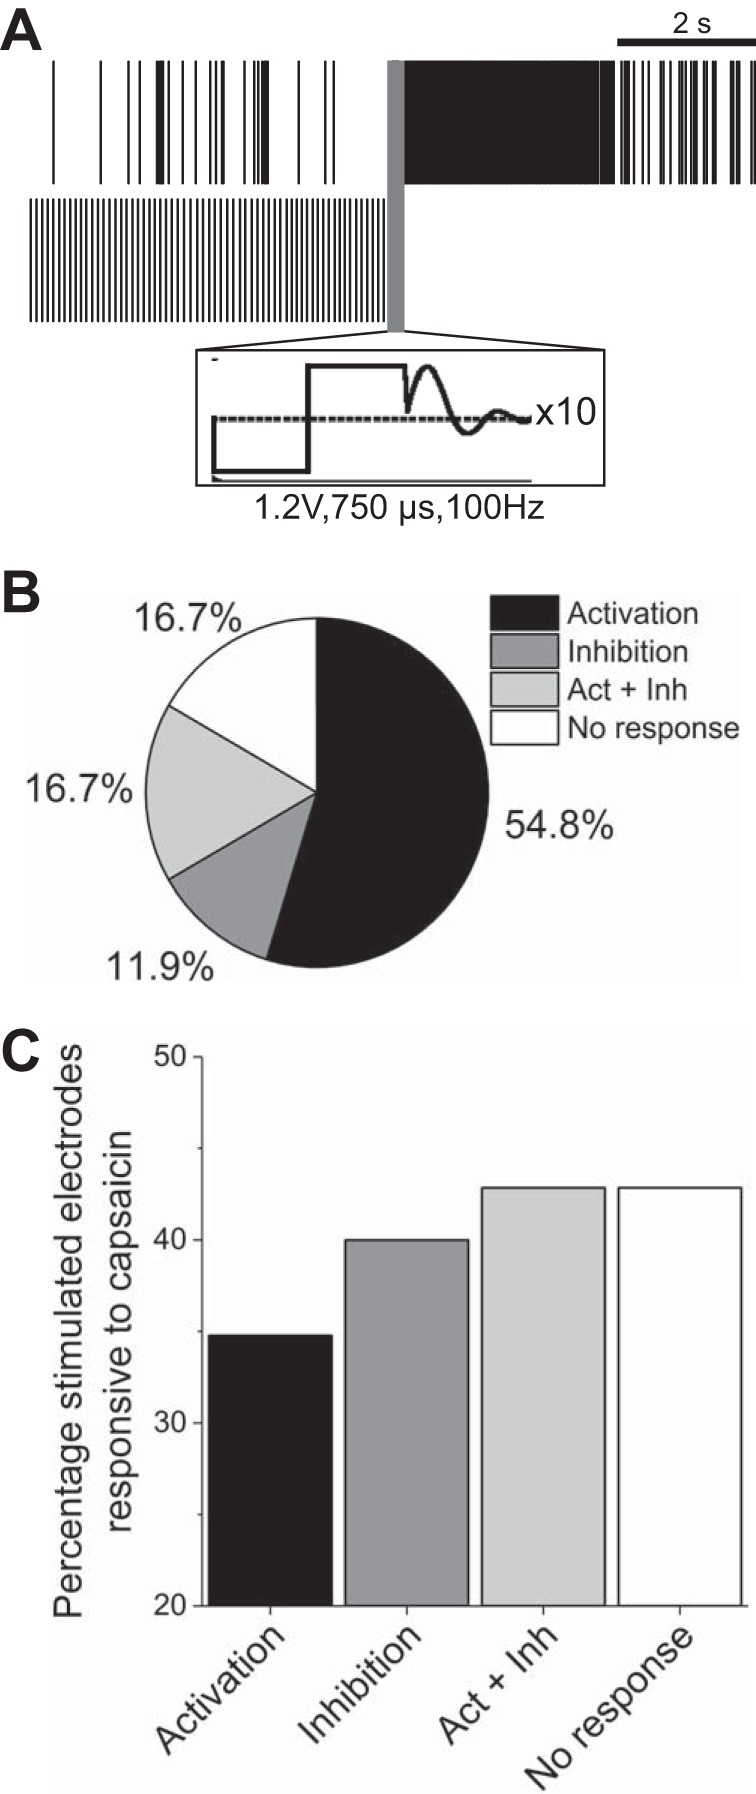
Electrical stimulation at frequencies >100 Hz elicits differential responsiveness. A: representative raster plots from 2 stimulated electrodes exhibiting either activation (top) or inhibition (bottom) of activity. Scale bar represents 2 s. Inset (black square) illustrates cathodic-leading biphasic waveform and artifact removal. B: percentage breakdown of electrodes that were activated, inhibited, both (Act + Inh), or neither (n = 42). C: percentage of stimulated electrodes found responsive to 1 μM capsaicin.