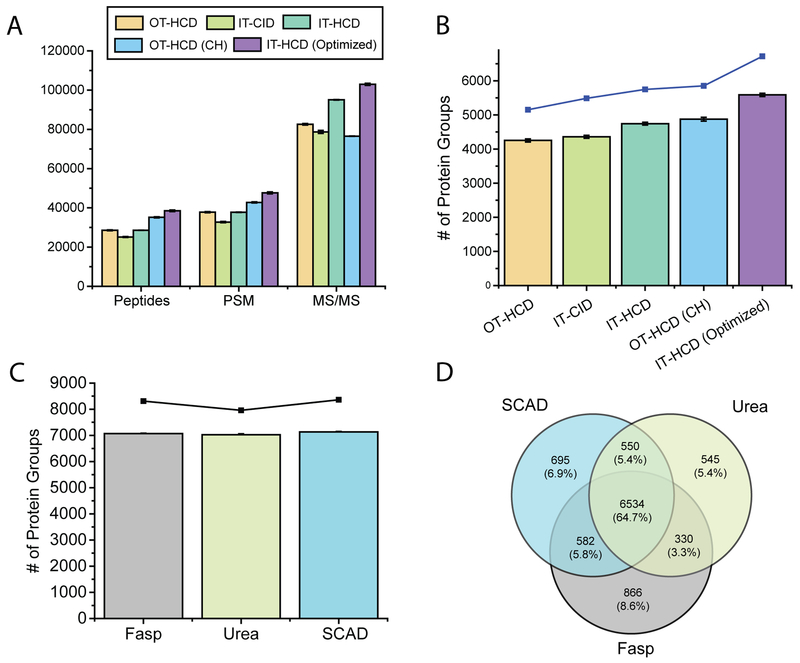
Figure 3.
Comparison of number of peptides, PSMs, and MS/MS (A) and protein groups (B) with different peptide sequencing approaches under 90 min gradient; number of proteins with optimized IT-HCD under 180 min gradient (C); Venn diagram showing overlap of proteins among different sample preparation strategies (D).

