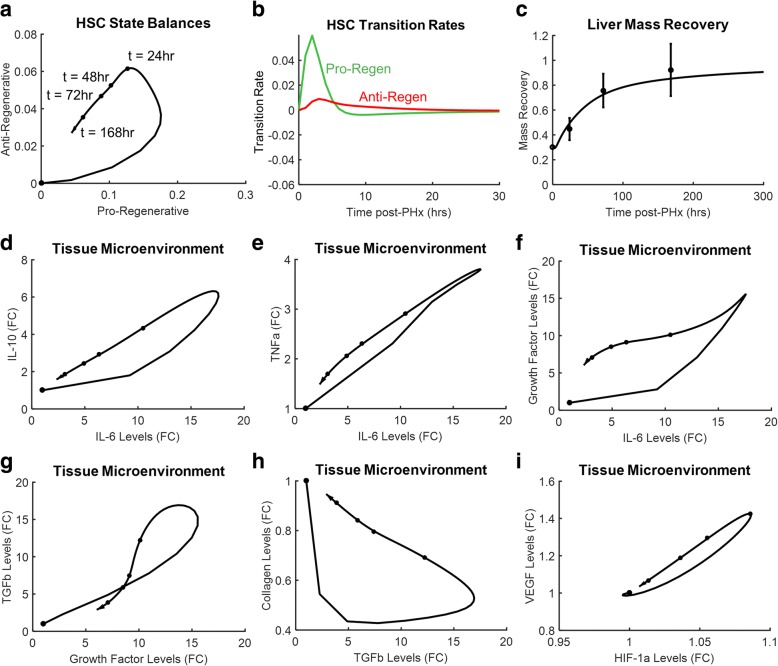
Fig. 3.
The dynamics of cell state balances and tissue microenvironment factors during successful liver regeneration visualized using a phase plane analysis. a Levels of pro-regenerative and anti-regenerative HSCs. b Transition rates of HSCs between quiescent and pro-regenerative (green) and between quiescent and anti-regenerative (red) states. c Simulated liver mass recovery compared to experimental data [36]. d-i Dynamic tissue microenvironment influences and is shaped by cell state balances. Dots on the phase planes represent time = 0 h, 24 h, 48 h, 72 h, and 168 h following resection

