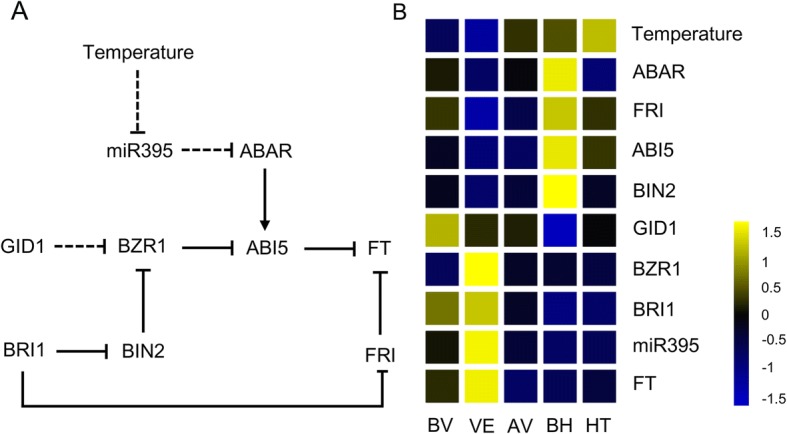
Fig. 7.

Analysis of gene expression in plant hormones pathways from growth stages BV to HT. a The putative network between GA, ABA and BR pathway. Line with arrows indicate positive regulation and line with blunt end indicated negative regulation. Dashed indicated the potential regulation. b The heatmap showed the gene expression involved in the network
