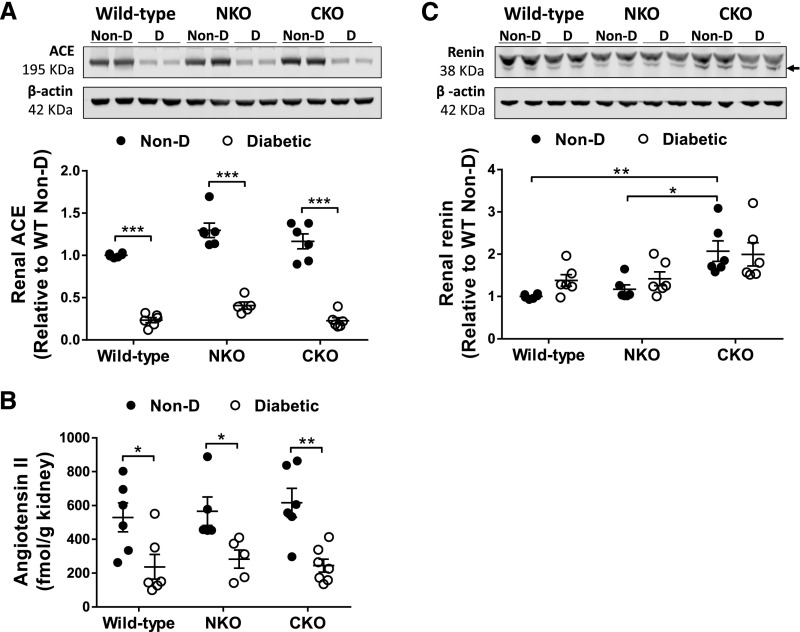
Figure 2.
Diabetes induced by STZ suppresses renal levels of ACE and angiotensin. (A) ACE expression was assessed by western blot and (B) angiotensin II was measured by ELISA in whole-kidney homogenates from nondiabetic (Non-D) and diabetic mice. (C) Renin expression was evaluated by western blot in whole-kidney homogenate; n=5–7. Immunoblots were performed with a constant amount of protein per lane; β-actin was used as loading control. Only blots from two representative samples are shown. Non-D WT group was considered as 1. *P<0.05; **P<0.01; ***P<0.001. Data are represented as individual values for each mouse (dots). Horizontal bars represent the mean±SEM.

