Figure 3.
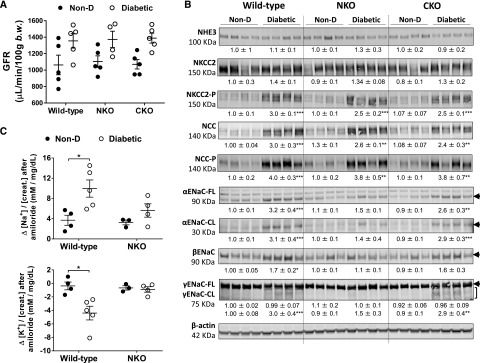
Lower ENaC activity in diabetic NKO mice compared with diabetic WT and CKO mice after 6 months of diabetes. (A) The assessment of GFR was performed using a transcutaneous detector after a single intravenous bolus of FITC-sinistrin; n=4–5. (B) Sodium transporter expression was analyzed in kidney homogenates from nondiabetic (Non-D) and diabetic mice. Immunoblots were performed with a constant amount of protein per lane; β-actin was used as loading control. Relative abundance from each group is displayed below the corresponding blot. Non-D WT group was considered as 1. Only blots from four representative samples are shown; n=5–7. (C) Difference (Δ) in urine [Na+]/[creatinine] (top panel) and [K+]/[creatinine] (bottom panel) between vehicle (0.9% saline) and amiloride injection (5 µg/g body wt in 100 µl 0.9% NaCl). Urine was collected for 4 hours; n=3–5. *P<0.05; **P<0.01; ***P<0.001 versus corresponding Non-D. Data are represented as individual values for each mouse (dots). Horizontal bars represent the mean±SEM.

