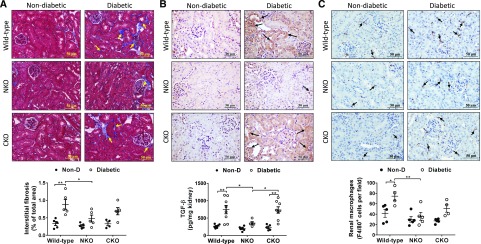
Figure 5.
Diabetic NKO mice display lower interstitial fibrosis and macrophage infiltration compared with diabetic WT. (A) Interstitial fibrosis in cortex was evaluated using Masson’s trichrome staining and expressed as the percentage of fibrotic area of the total cortical area from a whole-slide image. (B) TGF-β was assessed by immunohistochemistry (quantification in Supplemental Figure 3) and ELISA in whole-kidney homogenate and expressed as picograms of TGF-β per milligram of kidney protein. (C) Macrophage infiltration was assessed using F4/80 immunostaining and expressed as F4/80-positive cells per field. Fifteen fields per sample were analyzed. Original magnification, ×40. n=5 per group. *P<0.05; **P<0.01. Data are represented as individual values for each mouse (dots). Horizontal bars represent the mean±SEM.

