Figure 6.
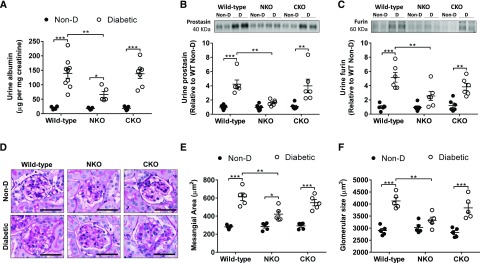
Diabetic NKO mice display less albumin and serine proteases in the urine compared with diabetic WT. (A) Microalbuminuria was measured by ELISA and expressed as micrograms of albumin per milligram of creatinine. n=5–9 per group. Urinary (B) prostasin and (C) furin were assessed by western blot in urine samples concentrated five-fold for nondiabetic and 20-fold for diabetic animals using centrifugal filters with a molecular mass cut-off of 10 kD. Immunoblots were performed with an amount of concentrated urine equivalent to 10 µg of creatinine; n=6. (D) Representative images of periodic acid–Schiff staining. Original magnification, ×40. For the quantification of (E) mesangial area and (F) glomerular size using periodic acid–Schiff staining, all glomeruli (80–120 glomeruli) from whole-slide scans were evaluated using ImageJ software; n=5. *P<0.05; **P<0.01; ***P<0.001. Data are represented as individual values for each mouse (dots). Horizontal bars represent the mean±SEM.

