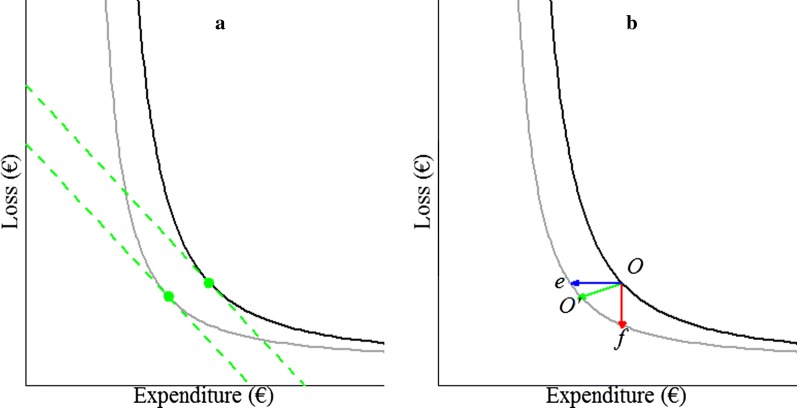
Fig. 1.
Loss-expenditure frontiers (solid curves) for two values of , with the frontier on top having the highest . a Green dots: economic optima, dashed lines: ∂Loss⁄∂Expenditure = − 1. b Reduction in cost due to a reduction in . Green arrow: reduction in losses and expenditures when moving from optimum O to optimum O′, blue arrow ending in e: reduction in expenditures at constant losses, red arrow ending in f: reduction in losses at constant expenditures

