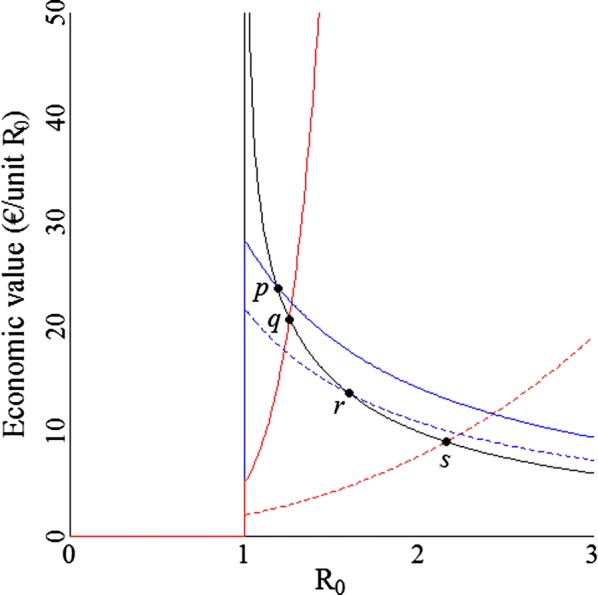
Fig. 3.

Economic values for a range of values for for different management strategies in the numerical example. Black line: optimized expenditures, red line: constant expenditures of €6, dashed red line: constant expenditures of €15, solid blue line: constant losses of €3.4, dashed blue line: constant losses of €5.3. Points p, q, r, and s are where a strategy with optimized expenditures results in the same economic value as strategies with constant expenditures or constant losses. Note that the minus sign in the economic value is ignored for presentation purposes
