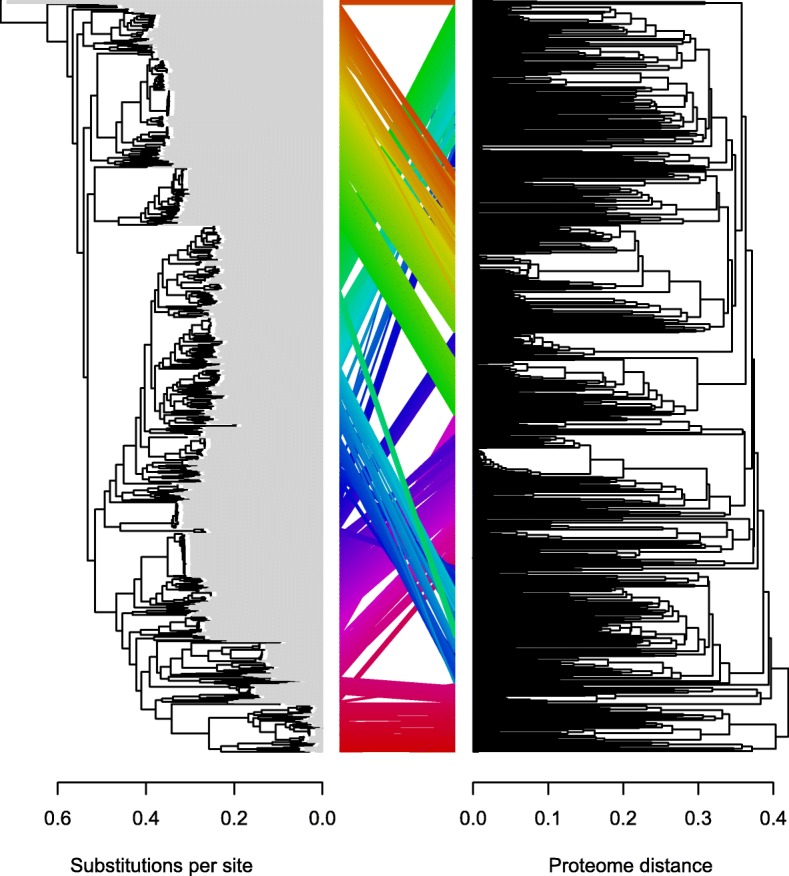
Fig. 2.

Strong correspondence between trees based on the core-genome and pan-genome in Streptomycetaceae. A maximum-likelihood tree from the core-genome (left) and a UPGMA tree based on gene content similarity (right) are similar in structure. The same 701 tips on both trees are connected by colored lines showing the degree of entanglement. Note that tips on the maximum likelihood core-genome tree (left) are extended by gray lines to the same horizontal position because the tree is not ultrametric like the pan-genome UPGMA tree (right)
