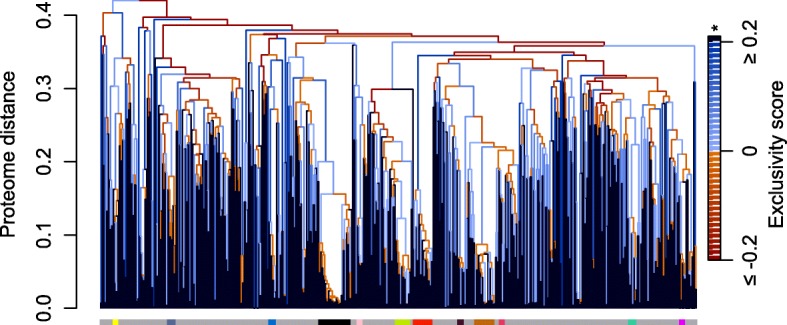
Fig. 3.

UPGMA tree of gene content similarity showing the distribution of exclusivity among 701 Streptomycetaceae genomes. Internal edges of the tree are colored based on their degree of exclusivity (see Methods), from not exclusive (orange) to exclusive (blue). Leaves of the tree are shown in dark blue because they are trivially exclusive (*). The horizontal bar below leaf tips is colored according to the 12 largest species (otherwise gray), here defined as single-linkage groups having AF > 0.6 and ANI > 96.5%. Exclusive groups are more frequent at lower taxonomic levels, which suggests either a lack of consistent signal to resolve deep relationships or true non-exclusivity due to wide hybridization events
