Fig. 1.

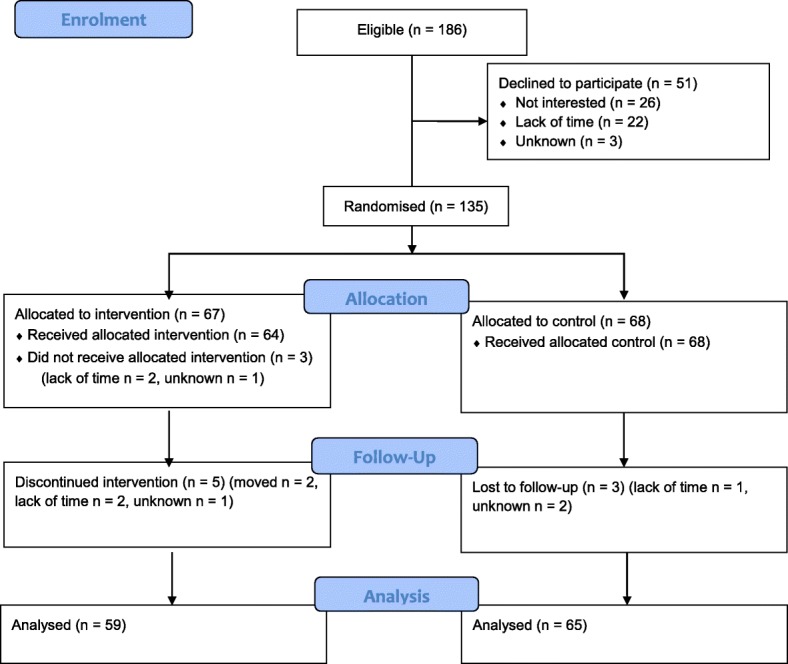
Flow diagram of the progress through the phases of the Intervention group and Control group: Enrolment, intervention allocation, follow-up and data analyses

Flow diagram of the progress through the phases of the Intervention group and Control group: Enrolment, intervention allocation, follow-up and data analyses