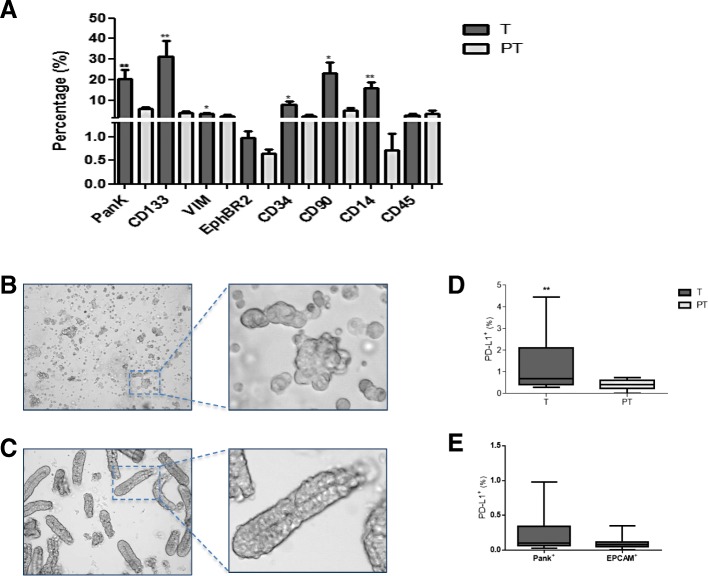
Fig. 1.
Phenotypic characterisation of isolated cells from colorectal cancer samples. Percentage of surface marker expression in cells from tumour (T, grey) vs. peritumour (PT, white) areas, immediately after isolation from patients with CRC (n = 15), as determined by FACS (a). Morphological appearance (10×) of tumour (b) and peritumour cells (c) immediately after isolation procedure. Percentage of PD-L1+ cells within tumour (T, grey boxes) and peritumour (PT, white boxes) areas, as measured by FACS (d). Percentage of PD-L1+ cells on PanK+ and EpCAM+ gated tumour cells from D (e). * p < .05, ** p < .01 using a Wilcoxon test

