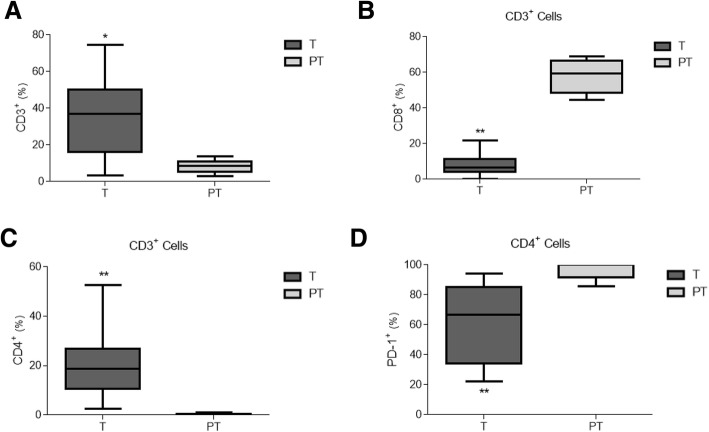
Fig. 3.
Characterisation of infiltrated T-lymphocytes in tumour and peritumour areas in colorectal cancer samples. Percentage of CD3+ cells within tumour (T, grey boxes) and peritumour (PT, white boxes) areas from patients with CRC (n = 15), as analysed by FACS (a). Percentage of CD8+ cells (b) and CD4+ cells (c) on CD3+ gated populations in A. Expression of PD-1 on CD4+ gated populations in C (d). * p < .05, ** p < .01 using a Wilcoxon test

