Fig. 6.
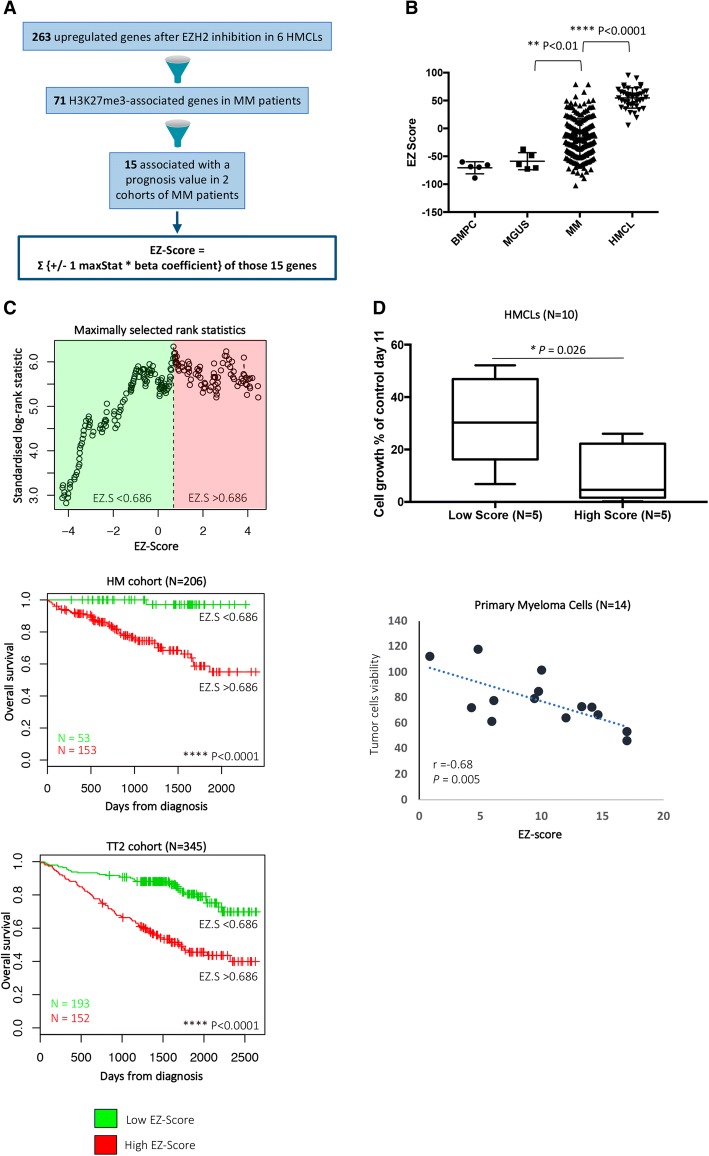
EZ score can predict for sensitivity of poor prognosis MM patients to EZH2i. a Chart explaining the process of the EZ score creation. b EZ score in normal BMPCs (N = 7), in premalignant PCs of patients with MGUS (N = 5), in MMCs of patients (N = 206) and in HMCLs (N = 40). Results were compared with a Student’s t test. c Prognostic value of the EZ score in MM. Patients of the HM cohort were ranked according to increased EZ score and a maximum difference in OS was obtained with EZ score of 0.686 splitting patients into high-risk (N = 153) and low-risk (N = 53) groups. EZ score also had a prognostic value of an independent cohort of 345 patients (UAMS-TT2 cohort). The parameters to compute the EZ score of patients of UAMS-TT2 cohort and the proportions delineating the two prognostic groups were those defined with HM cohort. d HMCLs with high EZ score (N = 5) exhibit significant higher EPZ-6438 sensitivity compared with HMCLs with low EZ score (N = 5). Data are mean values ± standard deviation of five experiments determined. e EZ score predicts for EPZ-6438 sensitivity of primary myeloma cells of patients. Mononuclear cells from tumor samples of 14 patients with MM were cultured for 8 days in the presence of IL-6 (2 ng/ml) with or without 1 μM EPZ-6438. At day 8 of culture, the count of viable MMCs was determined using CD138 staining by flow cytometry

