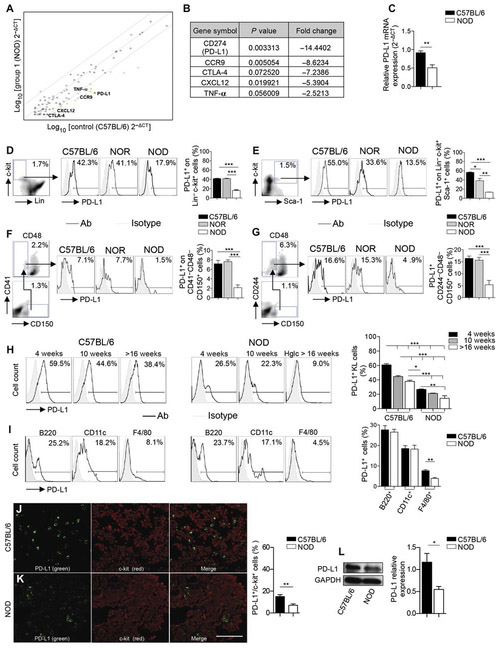
Fig. 1. PD-L1 is down-regulated In HSPCs from NOD mice.
(A and B) Transcriptomic profiling of KLS cells obtained from bone marrow of NOD and C57BL/6 mice; n = 3 samples per group were evaluated. Statistical analysis was performed also by using the software available (RT2 profiler PCR Array Data Analysis, Qiagen). TNF-α, tumor necrosis factor–α. (C) Bar graph representing mRNA expression of PD-L1 as measured by quantitative RT-PCR (qRT-PCR) in KL cells, collected from bone marrow of C57BL/6 and NOD mice. All samples were run in triplicate and normalized to expression of the housekeeping gene GAPDH. GAPDH, glyceraldehyde-3-phosphate dehydrogenase. (D to G) Representative flow cytometric analysis and quantitative bar graphs assessing PD-L1 expression in four populations of HSPCs in C57BL/6 and NOD mice. (H) Representative flow cytometry and quantitative bar graphs of PD-L1 expression in KL cells obtained from the bone marrow of C57BL/6 and NOD mice at different ages; n = 3 mice per group were evaluated and for statistical analysis, one-way analysis of variance (ANOVA) followed by Bonferroni multiple comparison test for group comparisons between C57BL/6 and NOD mice. Lin, Lineage; Ab, antibody; Hglc, hyperglycemic. (I) Representative flow cytometric analysis and quantitative bar graphs of PD-L1 expression in KL cells and in other nonprogenitor cells from bone marrow or spleen respectively obtained from C57BL/6 and NOD mice; n = 3 mice per group were evaluated. (J and K) Confocal imaging and quantification of bone marrow sections of C57BL/6 and NOD mice for c-kit (shown in red) and PD-L1 (shown in green) staining (n = 5 sections per strain); the quantification of the orange-stained bone marrow element was performed by ImageJ, and statistical significance was performed using two-tailed unpaired t test with Welch’s correction. Histology magnification, ×63. Scale bar, 40 μm. (L) Western blotting and quantitative bar graphs confirming reduced PD-L1 protein expression in KL cells obtained from bone marrow of C57BL/6 and NOD mice (n = 3 samples per group), with GAPDH used as an internal control. Data are expressed as means ± SEM. Data are representative of at least n = 3 mice. *P < 0.05; **P <0.01; ***P < 0.001.

