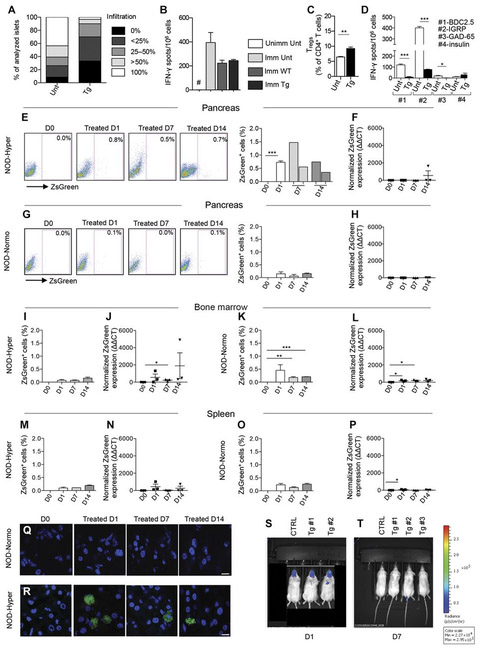
Fig. 4. Genetically engineered PD-L1.Tg KL cells traffic to the pancreas in hyperglycemic NOD mice.
(A) Insulitis score: n = 9 sections per group were analyzed. Unt, untreated. (B) OVA rechallenge test. Data are representative of one experiment performed in three mice per group, and statistical significance was determined by using two-tailed unpaired t test. Unimm Unt, unimmunized untreated; Imm Unt, immunized untreated; Imm WT, immunized treated with KL; Imm Tg, immunized treated with PD-L1.Tg KL cells. (C) Immunophenotypic analysis of lymphocytes isolated from spleens by flow cytometry of FoxP3+ regulatory T cells (Tregs) in PD-L1.Tg KL cell–treated NOD mice as compared to untreated NOD mice. Data are representative of one experiment performed in three mice per group, and statistical significance was determined by using two-tailed unpaired t test. (D) Quantification of IFN-γ-producing cells (with number of spots normalized for background) in an ex vivo assay, in which splenocytes were challenged with islet peptides [BDC2.5, IGRP, glutamic acid decarboxylase 65 (GAD-65), and insulin] 40 days after treatment in newly hyperglycemic PD-L1.Tg KL cell–treated NOD mice or in untreated hyperglycemic NOD mice. Data are expressed as means ± SEM, and statistical significance was determined by using two-tailed unpaired t test. Data are representative of at least n = 3 mice. *P < 005; **P < 0.01; ***P < 0.001. #P < 0.05 versus all; §P < 0.05 versus all. (E and G) Representative flow cytometric analysis and quantitative bar graphs of ZsGreen+PD-L1. Tg KL cells in the pancreas of hyperglycemic (Hyper) and normoglycemic (Normo) NOD mice at 1,7, and 14 days after treatment with PD-L1.Tg KL cells. Experiments were run in triplicate [in (F): in duplicate], and statistical significance was determined by using two-tailed unpaired t test. (F and H) Quantification of ZsGreen mRNA in the pancreas of hyperglycemic and normoglycemic NOD mice by qRT-PCR after treatment with PD-L1.Tg KL cells. (I and K) Bar graphs depicting flow cytometric quantification of ZsGreen+PD-L1.Tg KL cells and (J and L) quantification of ZsGreen mRNA by qRT-PCR in the bone marrow of hyperglycemic and normoglycemic NOD mice, after treatment with PD-L1.Tg KL cells. Experiments were run in triplicate [in (M): in duplicate], and statistical significance was determined by using two-tailed unpaired t test. (M and O) Bar graphs for flow cytometric quantification of ZsGreen+PD-L1.Tg KL cells and (N and P) quantification of ZsGreen mRNA by qRT-PCR in the spleen of hyperglycemic and normoglycemic NOD mice. (Q and R) Confocal imaging of pancreatic sections obtained from normoglycemic or hyperglycemic NOD mice after 1,7, and 14 days after treatment with ZsGreen+PD-L1.Tg KL cells. Histology magnification, ×63 in all confocal images. Scale bars, 5 μm. (S and T) Luminescent images of NOD mice adoptively transferred with luciferase+PD-L1.Tg KL cells after 1 and 7 days of treatment. Data are expressed as means ± SEM. Data are representative of at least n = 2 mice. Statistical significance was determined using two-tailed unpaired t test. *P < 0.05; **P < 0.01; ***P < 0.001. CTRL, control.

