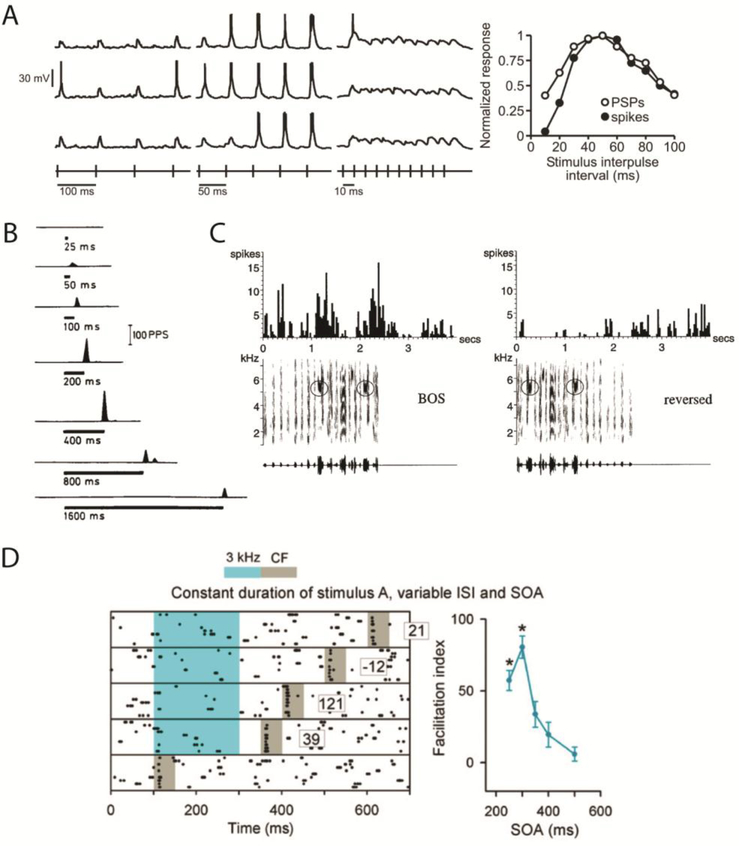
Figure 1. Temporal-selective neurons across species and modalities.
A. Voltage traces from a neuron in the midbrain of an electric fish. Each voltage trace represents the delivery of trains of electrical pulses presented at intervals of 100 (left), 50 (middle) and 10 ms (right). The rows represent three separate repetitions of each train. This neuron was tuned to pulses delivered at intervals of 50 ms (right). The right panel shows the tuning of the amplitude of the postsynaptic potentials (PSPs) and number of spikes. Reproduced from [32]. B. Duration tuned neuron in cat visual cortex. Off responses to a static bar of different durations, this neuron responded maximally to a duration of 400 ms. Of 174 neurons approximately 30% responded differentially to duration, and 3% showed sharp duration tuning curves. Reproduced from [45]. C. Auditory responses of a single unit in lateral portion of the magnocellular nucleus of the anterior neostriatum of an adult zebra finch. Response to the bird’s own song in forward (left) and reversed (right) order. Below each PSTH are shown the sonogram (frequency vs time plot, with energy in each frequency band indicated by the darkness of the signal) and the oscillogram (amplitude waveform) of the song stimulus used. BOS refers to “bird’s own song”. Adapted from [53]. D. Rastergram of a neuron from rat auditory cortex in response to five different stimuli, each composed of a 200 ms 3 kHz tone followed by a 50 ms 7 kHz (CF) tone with different stimulus-onset asynchrony. Numbers represent the facilitation index. Graph (right) shows the average interval tuning curve. Rats were trained to detect an inter-tone onset interval of 300 ms (middle row on left), and this was the spatiotemporal pattern that elicited the maximal response. Reproduced from [57].

