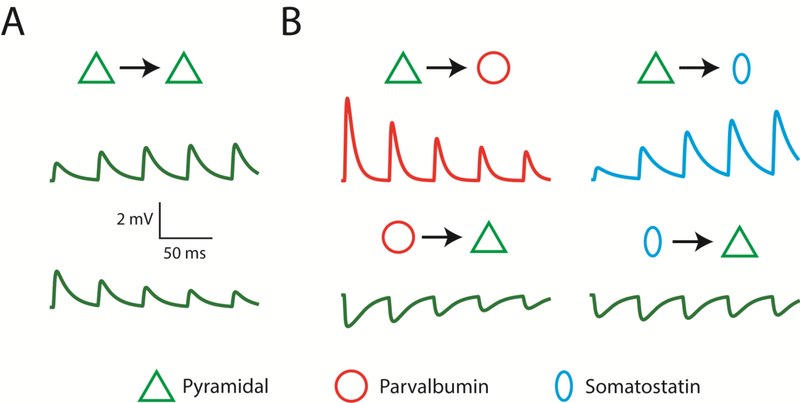
Figure 2. Diversity of short-term synaptic plasticity (STP) at cortical synapses.
Simulations of synaptic transmission with STP based on real whole cell recordings. Traces indicate voltage of the postsynaptic cell as the presynaptic cell fires a train of five action potentials at 20 Hz. Diagrams above each trace indicate the identity of pre- and postsynaptic neurons, including pyramidal (green triangle), Parvalbumin-positive inhibitory (red circle), and Somatostatin-positive inhibitory (cyan oval) cells. A. Facilitating (top) and depressing (bottom) inter-pyramidal synapses. Based on recordings performed for [79]. B. Excitatory-to-inhibitory (top row) and inhibitory-to-excitatory (bottom row) synapses. Based on recordings performed for [77].

