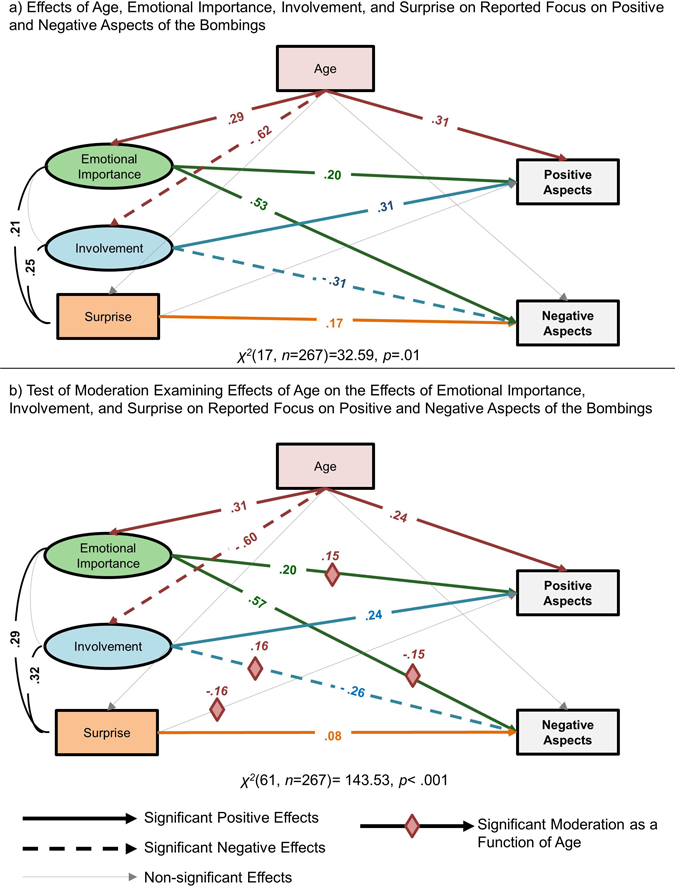
Figure 1.

Visual representation of best-fitting models examining a) main effects of age, emotional importance, involvement, and surprise on reported focus on positive and negative aspects of the bombings and b) main effects as well as moderating effects of age on effects of emotional importance, involvement, and surprise on reported focus on positive and negative aspects of the bombings. Red= Significant effects of age; Green= Significant effects of Emotional Importance; Blue= Significant effects of Involvement; Orange= Significant effects of Surprise; Black= Significant covariance among predictor variables; Gray= Non-significant paths that were included in the model to improve overall fit. Solid lines depict positive effects while dotted lines depict negative effects. Red diamonds= Significant moderating effects of age. Ovals = Latent Variables; Rectangles = Observed Variables. Values represent model estimates of each significant effect. See table for full list of estimates.
