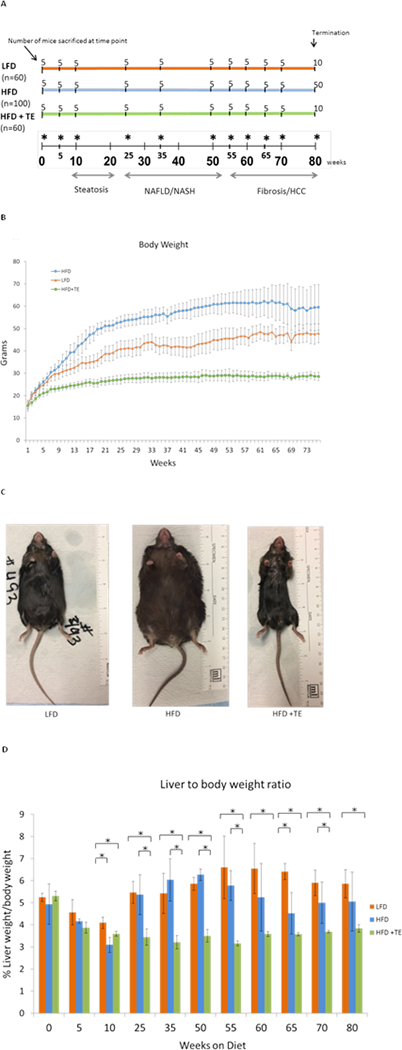
Figure 1.

(A) The number of mice collected at each time point across the duration of the tumor bioassay is shown (* indicates the collection time point). The time points indicate the number of weeks the mice were on each specific diet, starting at 0 weeks (4 weeks of age) and “n” is total number of mice in each group at the beginning of the bioassay. The disease stages based pathological examination are indicated progressively from steatosis to NAFLD/NASH to HCC. (B) Body weight curves of mice from the three groups. The mice were weighed weekly and the average weight of the animals in each group high fat diet (HFD), low fat diet (LFD) and high fat diet+2% TE (HFD+TE) was used. (C) Representative mouse from each diet group at the termination of 80 weeks. (D) The liver to body weight ratios (%) of the mice collected at each time point. Error bars represent standard deviation from five mice of each group of the designated time point. * indicates p<0.05 (Student’s t-test).
