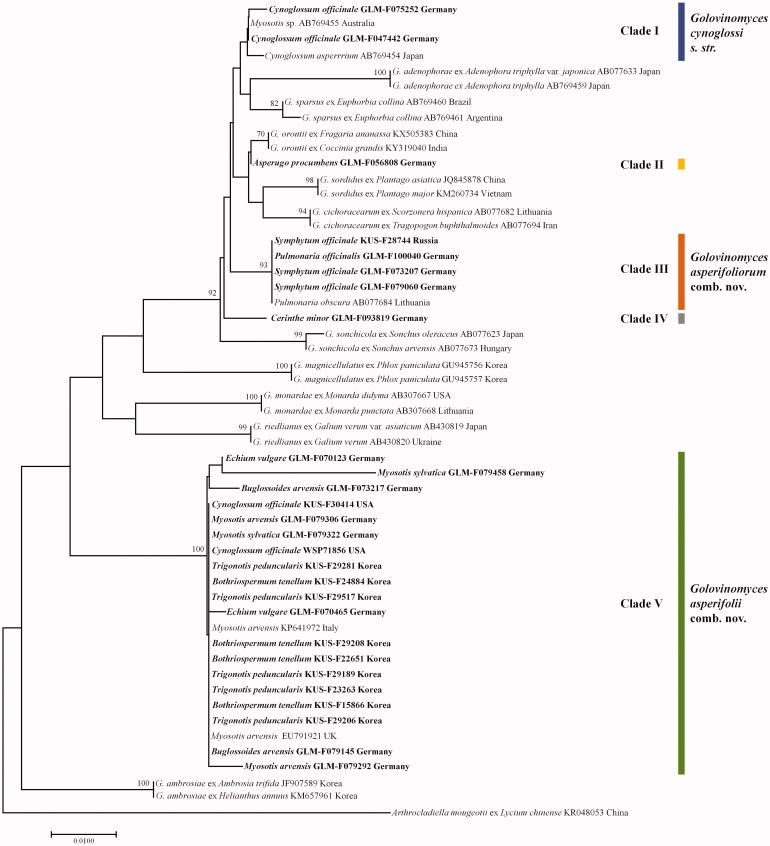
Figure 6.
Phylogenetic relationship between Golovinomyces cynoglossi, G. asperifoliorum, and G. asperifolii isolates and some reference isolates retrieved from GenBank, inferred by maximum likelihood method using the internal transcribed spacer regions. Bootstrap values based on 1000 replications are indicated above the branches. The scale bar represents 0.01 nucleotide substitutions per site. The isolates presented in this study are indicated in bold.

