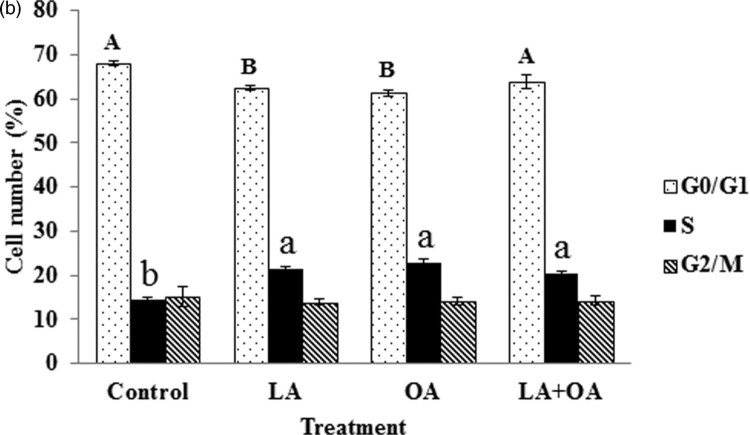
Figure 3.
Cell-cycle analysis after fatty-acid treatment. Cell-cycle analysis (G0/G1, S, and G2/M) of BSCs’ exposure to 100 µM of LA and OA for 24 h. Mean values with differing letters differ significantly (p < 0.05). Large character for G0/G1 and small character for S phase. Lack of letter is not significant.

