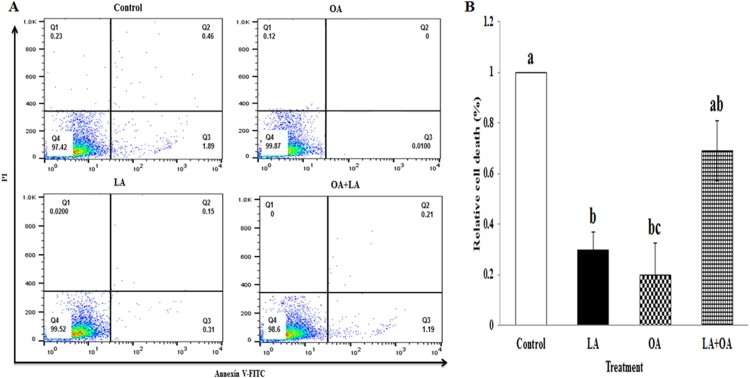
Figure 5.
FACS analysis of cell death. Effect of LA, OA, and the combination of both on cell death in exposure to 100 µM fatty acids for 24 h A (Control, LA, OA, LA + OA) and B, graphical representation. Each treatment was performed in triplicate. Mean values with differing letters differ significantly (p < 0.05).

