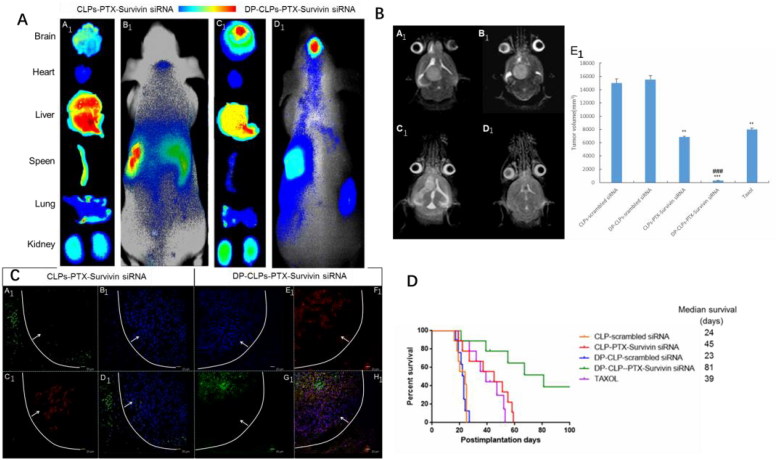
Figure 4.
(A) In vivo fluorescence imaging of intracranial U251-CD133+ glioma tumor-bearing nude mice treated for 24 h with CLPs–PTX–survivin siRNA (B1) or DP-CLPs–PTX–survivin siRNA (D1) liposomes, as well as corresponding dissected organs (A1 and C1). (B) Lesions in nude mice implanted in situ with U251-CD133+ cells after treatment with CLPs–scrambled siRNA (A1), CLPs–PTX–survivin siRNA (C1), DP-CLPs–scrambled siRNA (B1) or DP-CLPs–PTX–survivin siRNA (D1); all lesions were characterized by MRI at 19 days post-injection. U251-CD133+ cells were intracranially implanted in nude mice after 48 h treatment with Taxol, CLPs–PTX–survivin siRNA or DP-CLPs–PTX–survivin siRNA. Tumor size was measured 19 days post-injection (n = 5/group). **p < .01 versus control, ###p < .001 versus the CLPs–PTX–survivin siRNA group (E1). (C) Evaluation of apoptosis in the brains of intracranial U251-CD133+ glioma tumor-bearing nude mice treated with CLPs–PTX–survivin siRNA (A1–D1) or DP-CLPs–PTX–survivin siRNA (E1–F1) at 48 h post-administration 2 days after intravenous administration. Images were obtained using an Annexin V-FITC Apoptosis Detection Kit. Image D1 is the merge of images A1, B1 and C1; image F1 is the merge of E1, F1 and G1. Green: apoptotic cells. Red: CD133. Blue: cell nuclei. White line: glioma border. White arrow: glioma direction. Original magnification: ×100. (D) Survival curve of U251-CD133+ glioma tumor-bearing nude mice.

