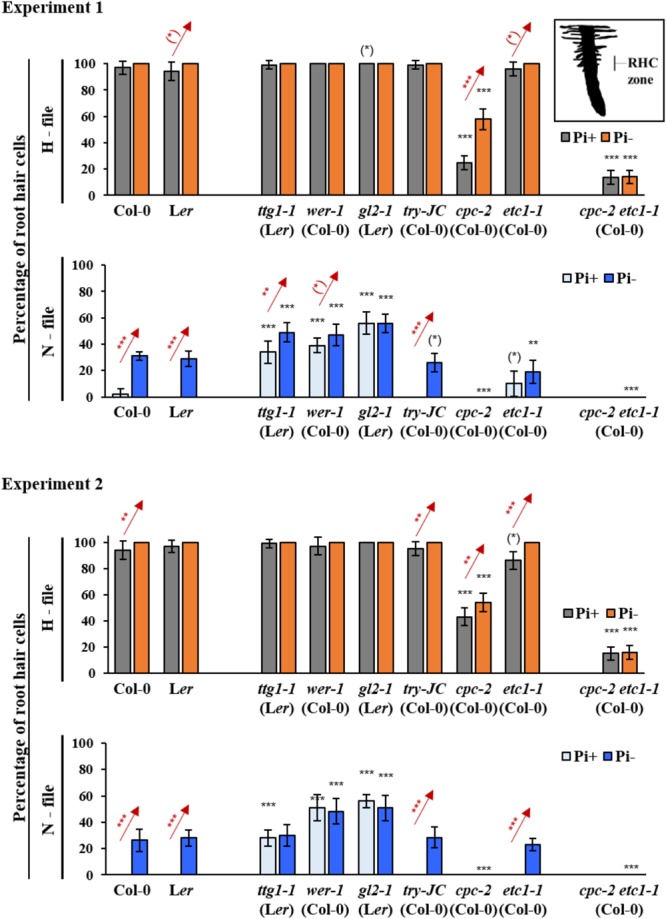
FIGURE 1.

Quantitative analysis of root hair formation in response to phosphate starvation in wild type and mutant genotypes. Two independent experiments are shown in which root hair number is compared in N- and H files between at least 10 wild type and mutant seedlings under normal conditions and under phosphate starvation conditions. RHC zone indicates the region of root hair analysis. Red stars indicate a significant difference between Pi+ and Pi– conditions at ∗p < 0.5, ∗∗p < 0.01, ∗∗∗p < 0.001 (Wilcoxon test). Black stars indicate a significant difference between wild type and mutants at ∗p < 0.5, ∗∗p < 0.01, ∗∗∗p < 0.001 (Wilcoxon test).
