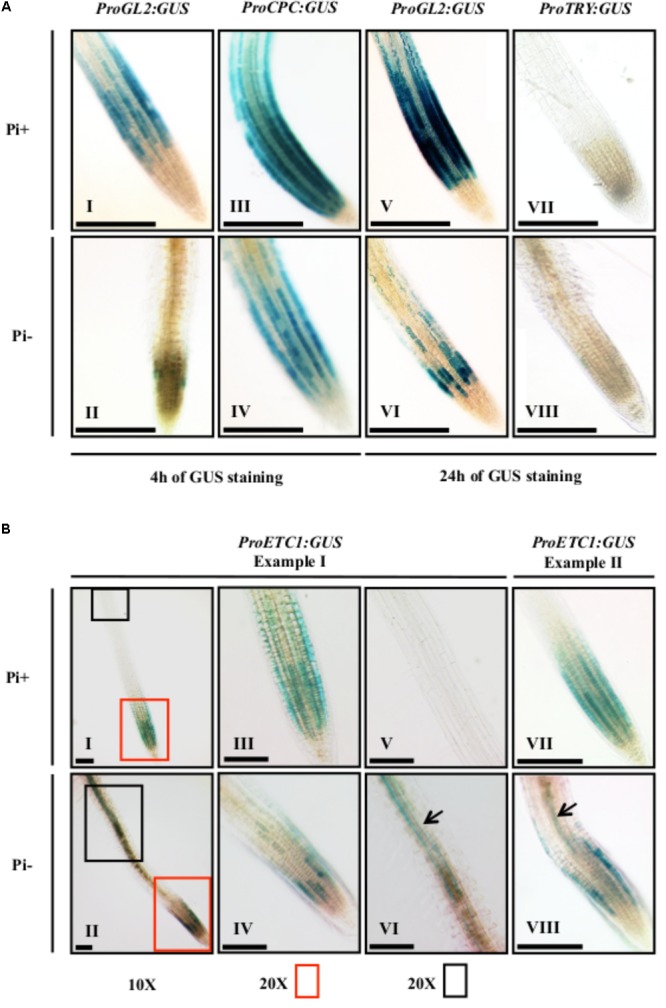
FIGURE 2.

Histochemical GUS expression analysis of ProCPC, ProGL2, ProTRY, and ProETC1. GUS expression staining was done on 7-day old seedlings grown on Pi+ media and Pi– media. (A) GUS expression of ProCPC, ProGL2, and ProTRY. GUS staining was done for 4 h in seedlings (I–IV) and for 24 h in seedlings (V–VIII). A reduction in GUS expression was noticed for ProGL2 and ProCPC in seedlings grown under Pi– conditions (II, IV, VI) as compared to seedlings grown on Pi+ (I, III, V). No GUS expression was detected for ProTRY under both Pi+ and Pi– conditions (VII, VIII). (B) GUS expression of ProETC1. Two examples are shown to depict the variability of the expression pattern. Plant I (I, II) shows an overview and higher magnifications of the root tip (III, IV) and a more distal region (V, VI). A new expression domain of ProETC1 was found in the sub-epidermis under Pi– conditions (black arrows in VI and VIII). Scale bars: 200 μm.
