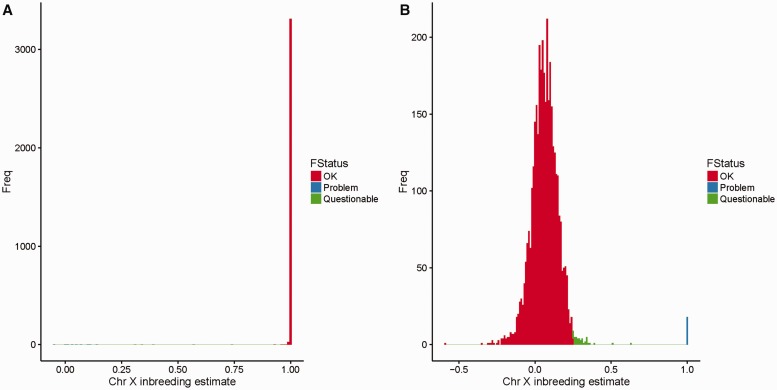
Figure 7.
(A) An example of a histogram for the chromosome X inbreeding estimate computed by PLINK for males. (B) An example of a histogram for chromosome X inbreeding estimate computed by PLINK for females. The red color (Right in A and Left in B) indicates subjects with no obvious problems; the blue color (Left in A and Right in B) indicates samples with definitive problems that could be caused by blood transfusion, self-reporting or data entry errors. The green color (middle) indicates questionable samples, as they are outside the normal range for inbreeding estimates, but not strong enough to be defined as outliers. We recommend flagging these samples and deciding whether to exclude them based on other QC metrics. A colour version of this figure is available at BIB online: https://academic.oup.com/bib.

