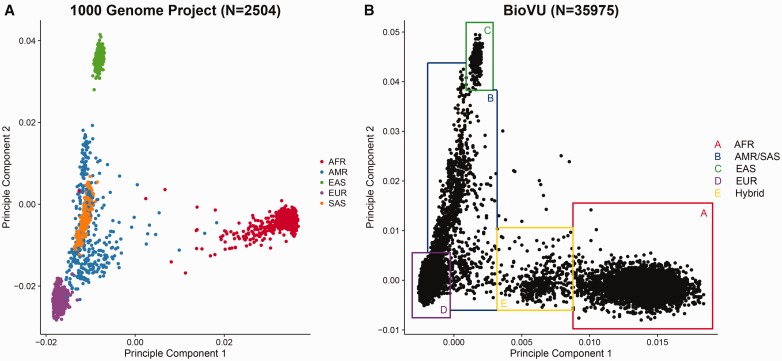
Figure 8.
(A) Scatter plot of PC1 versus PC2 computed by EIGENSTRAT from 1000G genotyping data. The samples are closely clustered by race. AFR=African ancestry populations, AMR=American Hispanics, EAS=East Asians, EUR=Caucasians, SAS=South Asians. Few outliers of race can be observed in the 1000 Genome Project data beyond that attributable to admixture. (B) Scatter plot of PC1 versus PC2 computed by EIGENSTRAT from Illumina exome array data. The shape of the clusters roughly resembles the one from the 1000 Genome Project. Instead of using self-reported race, we can determine the race by drawing boxes around clusters. Samples on the borders or outside the border of the boxes are ambiguous, as they could be results of blood transfusion or self-reporting or data entry errors. The Box E (yellow) indicates a group of likely first-generation mixed-race subjects between African and Caucasian ancestors. Such detailed ancestry information is usually not captured by self-report of race. This supports the rational that during association analysis, PCs should be used as surrogates of self-reported race. A colour version of this figure is available at BIB online: https://academic.oup.com/bib.

