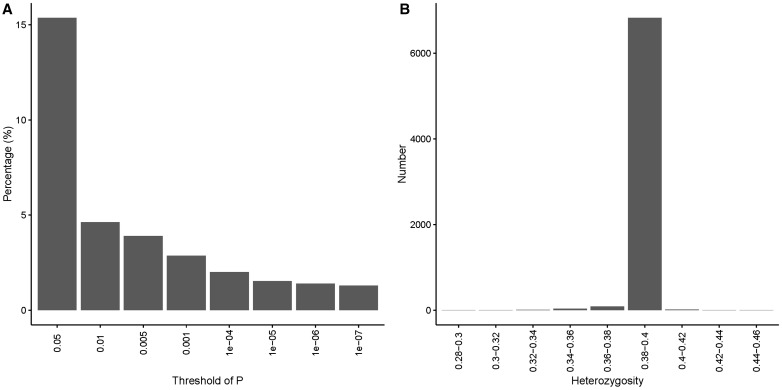
Figure 9.
(A) An example of the distribution of HWE P-values computed by PLINK from a genotyping data set of Caucasians obtained from the Illumina MEGAEX array. Only SNPs with extreme P-values (right) should be candidates for removal. (B) An example of the distribution for heterozygosity computed by PLINK from a genotyping data set of Caucasians obtained from the Illumina MEGAEX array. The majority of samples has heterozygosity values between 0.35 and 0.45. Only samples with extreme heterozygosity values are candidates for removal. Note that the expected heterozygosity value can differ by race [40].

