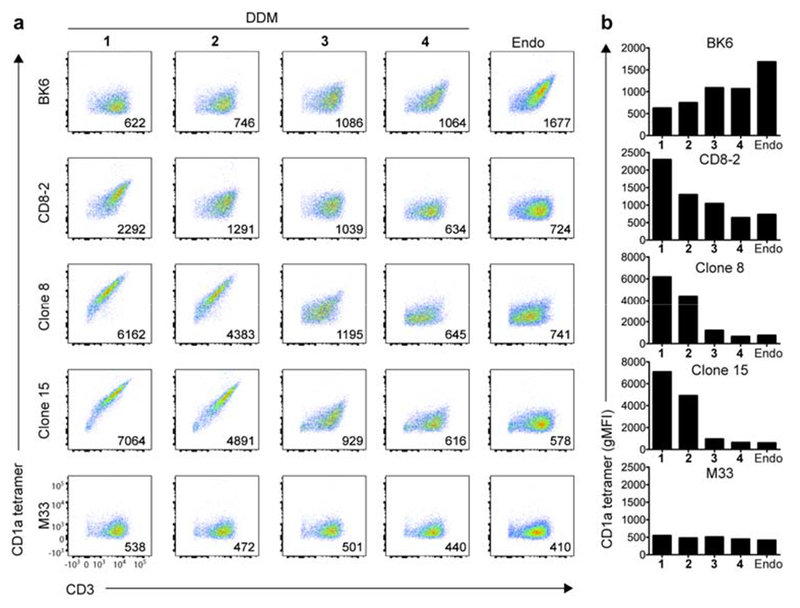
Figure 3.

Reactivity of CD1a-restricted TCR+ Jurkat cell clones to DDM isomers, (a) Flow cytometry (left) of BK6, CD8-2, Clone-8, Clone-15 and M33 TCR expressing cells labeled with CD1a-endo tetramers or CD1a tetramers loaded with DDM-838 (cis-SSRS) 1, DDM trans-SSRS 2, DDM (cis-SRRS) 3 and DDM (trans-SRRS) 4, or endogenous lipid antigen (Endo). Numbers in the bottom right corner indicate geometric mean fluorescence intensity (gMFI) of staining with CD1a-DDM or CD1a-endo. (b) gMFI of each T cell line against endo and DDM isomers 1-4. Data are representative of three independent experiments.
