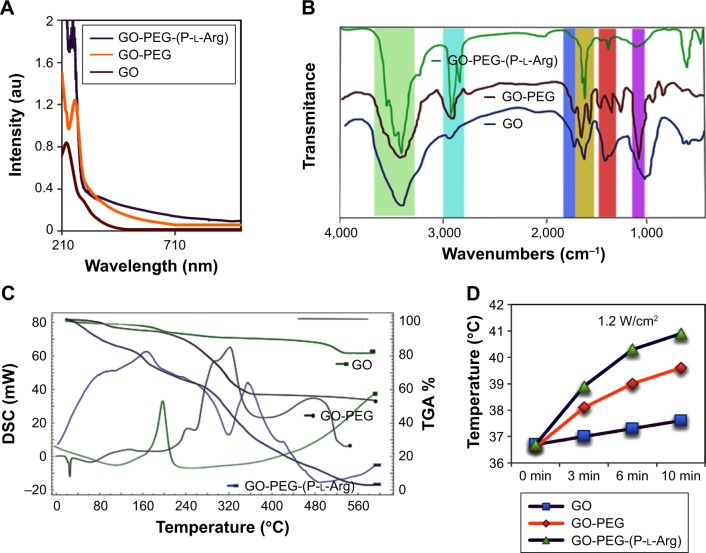
Figure 2.
Optical UV-Vis spectra of GO and functionalized GO. GO shows absorbance peak at 230 nm, while functionalized GO induced red shift in C–C bond to 263 nm. Also, absorbance in 808 nm increased >7-fold due to modification and reduction (A). FTIR spectra of pristine GO and modified single-layer GO (GO-PEG, GO-PEG-(P-l-Arg)) (B). TGA and DSC of GO, GO-PEG, and GO-PEG-(P-l-Arg), decomposition takes place up to 600°C, and scanning rate was evaluated every 10 min (C). Thermal conductivity of GO, GO-PEG, GO-PEG-(P-l-Arg) (4 mg/L) aqueous suspension in PBS under 808 nm NIR laser irradiation for 10 min (D).
Abbreviations: DSC, differential scanning calorimetry; GO, graphene oxide; PEG, polyethylene glycol; P-l-Arg, poly-l-arginine; TGA, thermogravimetic analysis; NIR, near infrared; FTIR, Fourier transform infrared.

