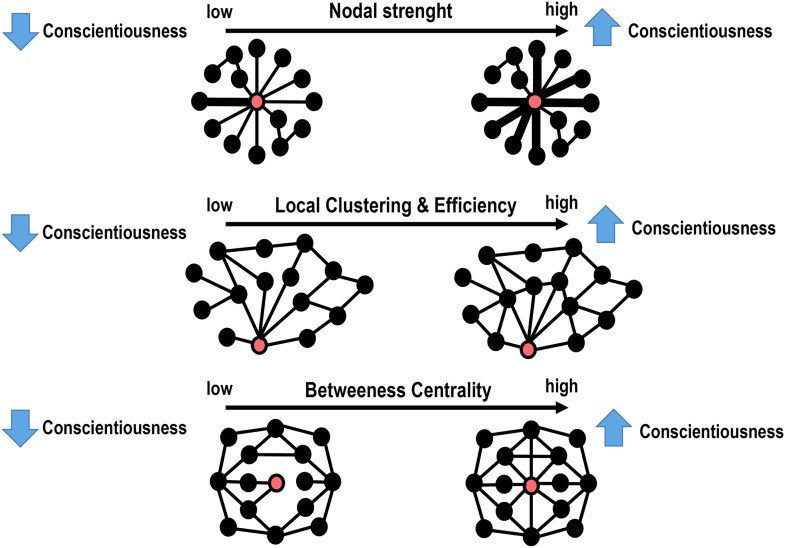
Figure 3.
Schematic representation of the main results. Depending on the graph metric (Table 2), the red circle represents either the left or right fronto-parietal network (FPN) or the default mode network (DMN), whereas the black circles represents the 14 remaining network nodes. Top row: The thicker lines in individuals with high levels of conscientiousness indicate the existence of higher strength in the “communications” between the left FPN and the other brain networks. Middle row: People scoring higher in conscientiousness show a higher degree of inter-connectedness between the left FPN and DMN and the local networks consisting of direct neighbours of the left FPN and DMN. Bottom row: The DMN and right FPN have higher betweenness centrality in individuals with higher levels of conscientiousness. This means that the DMN and right FPN are “hub” nodes in conscientious people.

